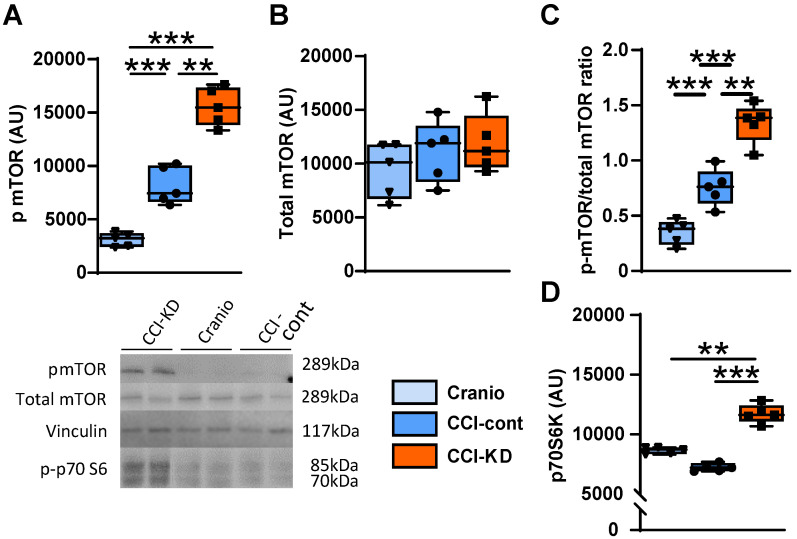
Figure 7.
mTOR pathway. Graph and representative cropped gels of western blot analysis of protein levels of: (A). Phosphorylated mTOR (Ser2448) (289 kDa) (One-way ANOVA p < 0.0001, F(2, 11) = 37.44; Tukey's multiple comparisons test **p<0.01, ***p<0.001), (B). Total mTOR; 289 kDa (One-way ANOVA: ns, F(2, 14) = 0.5253; Tukey's multiple comparisons test: ns), and (C). Phosphorylated-mTOR/total mTOR ratio.

