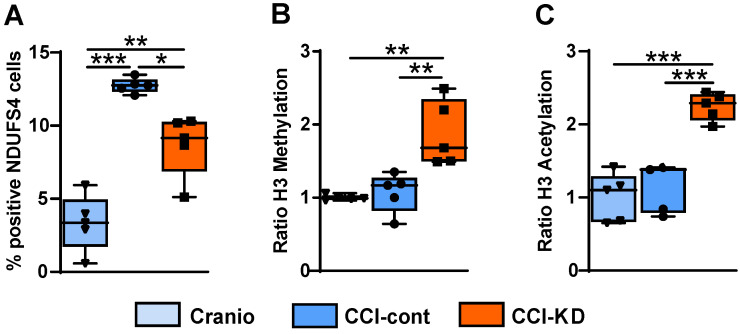
Figure 8.
Complex-I mitochondrial marker. (A). Quantification of NDUFS4 positive cells 70 days post-TBI (One-way ANOVA p = 0.0006, F(2, 9) = 19.18; Tukey's multiple comparisons test *p<0.05, **p<0.01 ***P<0.001). Epigenetics markers. Quantification of (B). H3K9 Methylation ratio (One-way ANOVA p =0.0004, F(3, 15) = 11.33; Tukey's multiple comparisons test **p<0.002) and (C). H3K9 Acetylation ratio (One-way ANOVA p <0.0001, F(3, 15) = 20.71; Tukey's multiple comparisons test ***p <0.001). All measurements were assessed at 70 days post-TBI. n=5/group.

