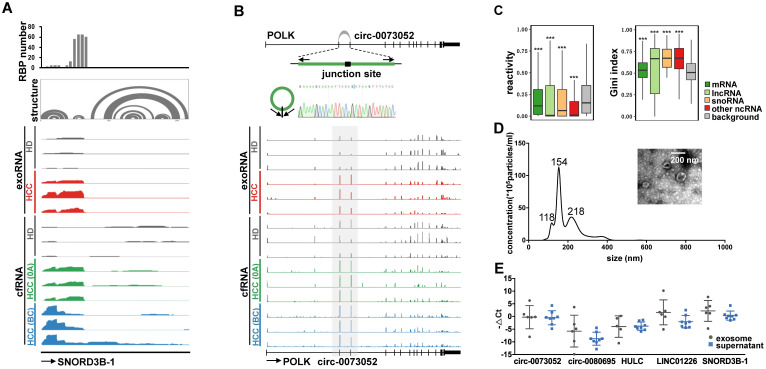
Figure 5.
Examples of the selected exRNA biomarkers for liver cancer detection. (A) RBP binding profile, RNA secondary structure and reads distribution of exoRNA-seq and cfRNA-seq for SNORD3B-1. (B) The genomic locus of circ-0073052 in POLK gene. The supported unique reads are presented. The expression of circ-0073052 was validated by RT-qPCR followed by sanger sequencing. Arrows represent divergent primers binding to the genome region of circ-0073052. Reads distributions of POLK and circ-0073052 for exoRNA-seq and cfRNA-seq show the differential expression pattern (in the gray box) of circ-0073052 instead of POLK. (C) Enrichment of RNA secondary structure in up-regulated mRNAs, lncRNAs, snoRNAs, and other ncRNAs. Comparison of icSHAPE reactivities (left box-plot) and gini indexes (right box-plot) between up-regulated RNAs identified by exoRNA-seq and shuffled background RNAs. Higher icSHAPE reactivity represents more unpaired bases in a RNA. Higher gini index represents that RNA is more structured. ***: P-value < 0.001, **: P-value < 0.01, *: P-value < 0.05, Wilcoxon rank sum test. (D) Characterizations of exosomes purified from plasma mixtures. The curve indicates the diameter distribution of exosomes by Nanosight. The transmission electron micrograph shows the external morphology of exosomes. (E) Relative expression levels measured by RT-qPCR of the 5 selected long exRNAs in exosome and supernatant isolated from the same samples. No significant difference between exosome and supernatant (Wilcoxon rank sum test).

