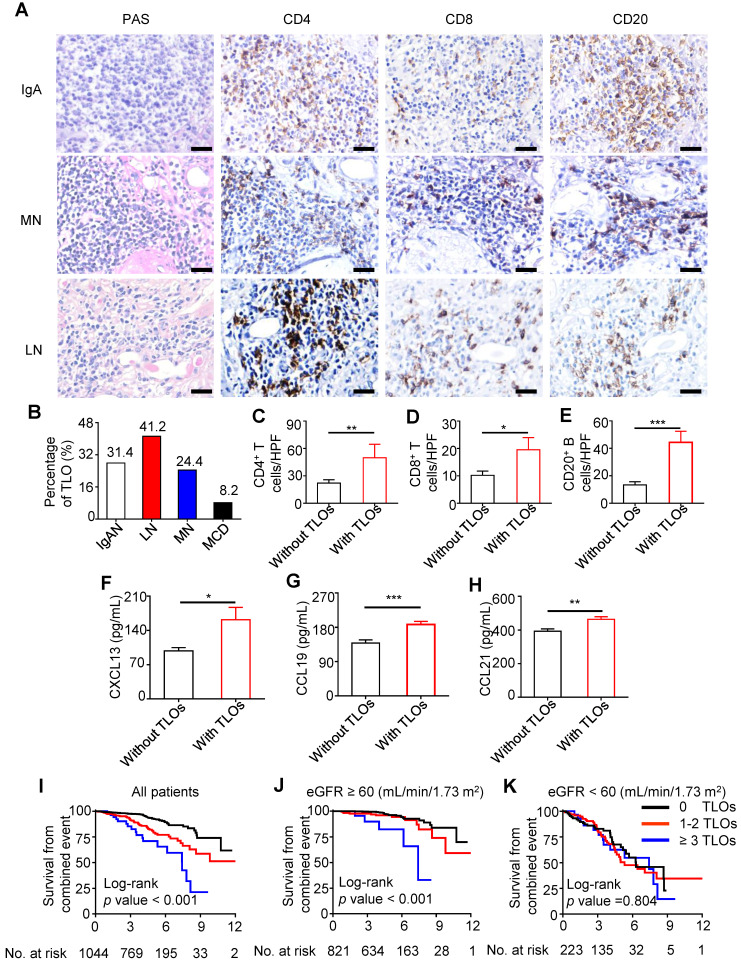
Figure 1.
Renal TLOs developed in patients with kidney damage and were associated with renal progression in IgAN patients. (A) Representative renal TLOs in kidneys of multiple pathological types were stained by PAS. CD4+ T cells, CD8+ T cells, and CD20+ B cells in TLOs were stained by immunohistochemistry. (B) The proportion of TLOs in renal biopsy specimens of IgAN (N = 1044), LN (N = 85), MN (N = 127), and MCD (N = 49) patients. (C-E) Comparison of interstitial inflammatory cells, including CD4+ T cells (C), CD8+ T cells (D), and CD20+ B cells (E) in renal biopsy specimens of IgAN patients with TLOs group (N = 43) and without TLOs group (N = 10). (F-H) Plasma levels of CXCL13 (F), CCL19 (G), and CCL21 (H) were increased in IgAN patients with renal TLOs (N = 32) compared with IgAN patients without renal TLOs (N = 41). (I-K) Kaplan-Meier curves of the renal combined event survival of all IgAN patients (I), IgAN patients with eGFR ≥ 60 mL/min/1.73 m2 (J), IgAN patients with eGFR < 60 (mL/min/1.73 m2) (K) who were divided into three groups: without TLOs under 10 equivalent HPFs, with 1-2 TLOs under 10 equivalent HPFs, and ≥ 3 TLOs under 10 equivalent HPFs. PAS, Periodic acid-Schiff; IgAN, IgA nephropathy; LN, lupus nephritis; MN, membranous nephropathy; MCD, minimal change disease; eGFR, estimated glomerular filtration rate. *P < 0.05, **P < 0.01, ***P < 0.001. Data represent mean ± SEM, Scale bar = 20 µm. P-values were calculated using a two-tailed t test or Kaplan-Meier survival curves.

