Figure 2.
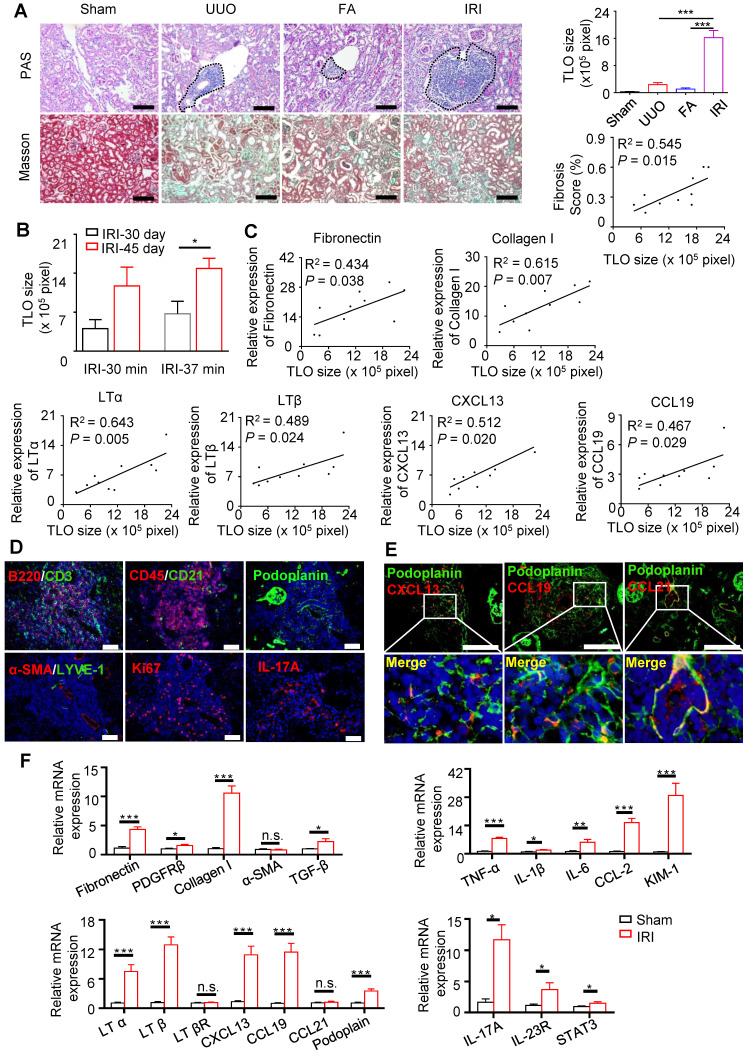
TLOs were induced in aged mouse kidneys after renal injury. (A) PAS and Masson staining. TLOs size of sham mice (N = 4), UUO mice (N = 5) (day 14), FA mice (N = 4) (day 21), and IRI mice (day 45 after 37-min IRI) (N = 6) and correlation between renal TLOs size and renal fibrosis score of mice at day 45 after 37-min IRI (N = 10). (B) TLOs size of mice after 30-min and 37-min IRI and sacrificed at day 30 and day 45 (N = 3 per group). (C) Correlation between TLOs size and mRNA level of fibronectin, collagen I, LTα, LTβ, CXCL13, and CCL19 in kidney of mice at day 45 after 37-min IRI (N = 10). (D) Immunofluorescence analysis of CD3 and B220, CD45 and CD21, podoplanin, LYVE-1 and αSMA, Ki67, and IL-17A. (E) Immunofluorescence analysis of CXCL13, CCL19 and CCL21 with podoplanin. (F) Renal fibrosis, inflammation, TLO-related chemokine, lymphotoxin and podoplanin, and Th17-related markers in kidneys of mice at day 45 after 37-min IRI analyzed by real-time PCR (N = 7 per group). UUO, unilateral ureteral obstruction; FA, folic acid; LYVE-1, lymphatic vessel endothelial hyaluronan receptor 1; αSMA, α-smooth muscle actin; IL-17A, Interleukin (IL)-17A. *P < 0.05, **P < 0.01, ***P < 0.001. Data represent mean ± SEM, Scale bar = 100 µm. P-values were calculated using a two-tailed t test.

