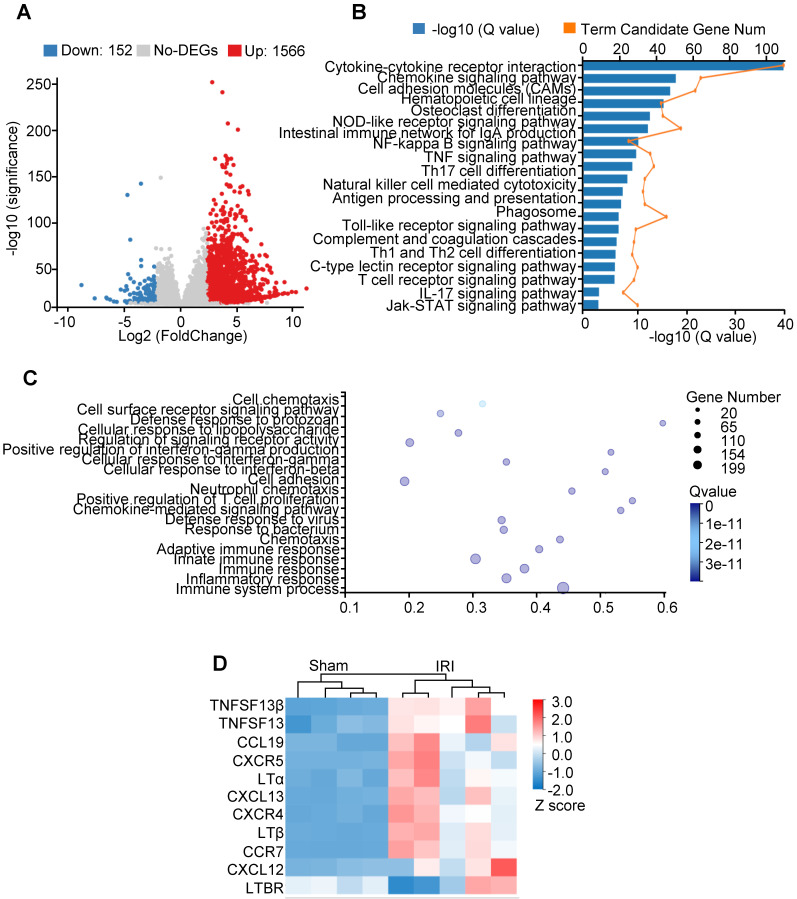
Figure 3.
Transcriptome analysis of kidneys in aged IRI mice. (A) Volcano plot of gene expression changes. One thousand five hundred sixty-six upregulated genes and 152 downregulated genes with fold change ≥ 4 and adjusted P value ≤ 0.001 were found. (B) KEGG pathway functional enrichment analysis of all upregulated DEGs (FDR ≤ 0.01). (C) GO enrichment analysis of all the upregulated DEGs (FDR ≤ 0.01). (D) Heatmap of selected enriched terms (FDR ≤ 0.01) from KEGG pathway analysis of upregulated DEGs. GO, gene ontology; DEGs, differentially expressed genes; FDR, false discovery rate; KEGG, Kyoto Encyclopedia of Genes and Genomes.

