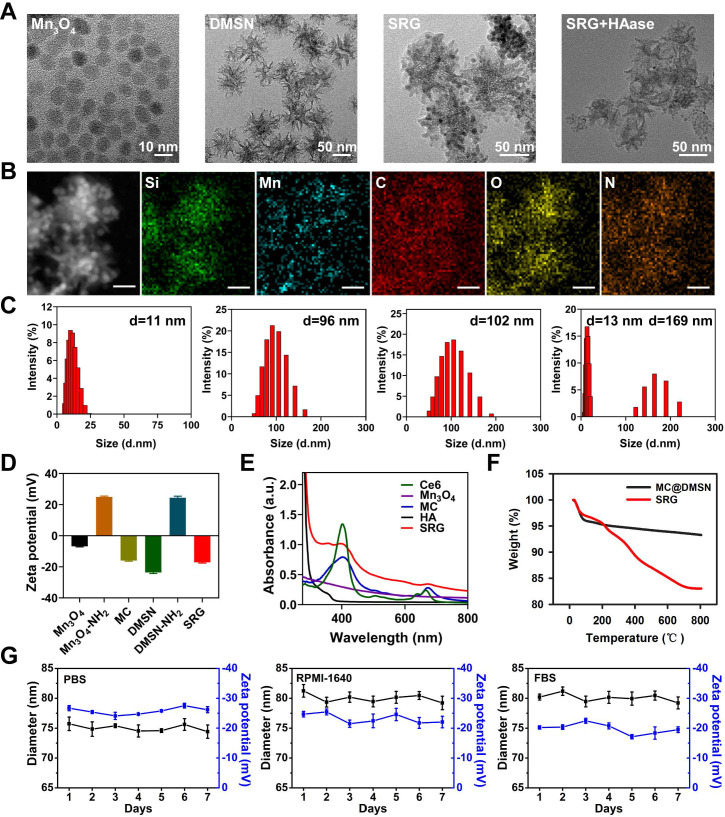
Figure 1.
Characterization of SRG. (A) TEM images of different preparations. (B) STEM-EDS elemental mapping images of SRG (Scale bar: 25 nm). (C) The dynamic light scattering images corresponding to the TEM images of (A). (D) Zeta-potential of varies preparations (n=3). (E) UV-vis spectra of varies preparations. (F) TGA curves of MC@DMSN and SRG. (G) SRG was incubated in PBS, RPMI-1640 and FBS at 37 °C, respectively, the diameter and zeta potential were recorded as a function of time.

