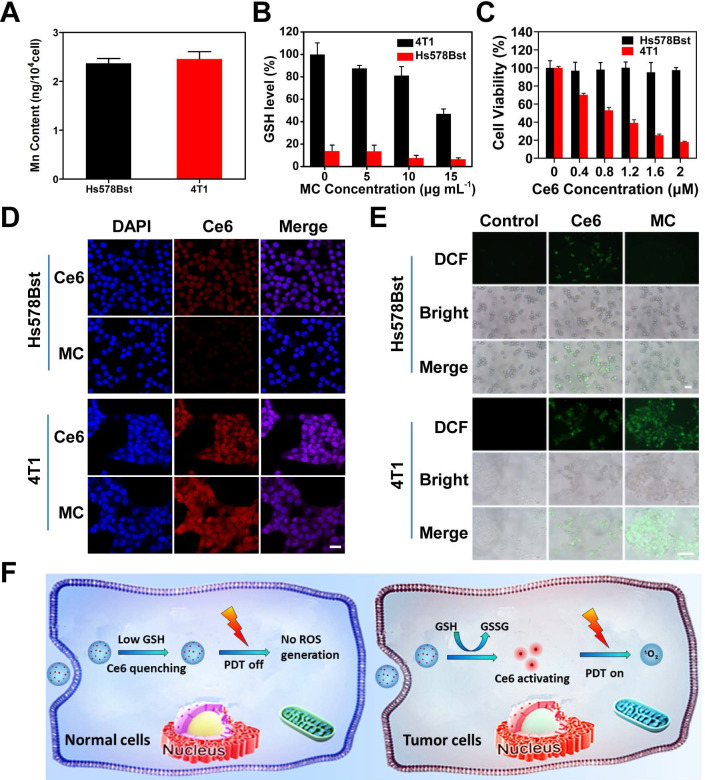
Figure 3.
Activation of MC in tumor cells. (A) Mn content in cells, Hs578Bst cells were treated with MC for 6 h and 4T1 cells were treated with MC for 4 h. (B) The GSH level of different cells after treatment with different concentrations of MC, respectively. (C) Phototoxicity of MC to Hs578Bst cells and 4T1 cells after 660 nm irradiation for 2 min. (D) CLSM images of different cells incubated with Ce6 and MC, respectively (scale bar: 25 µm). (E) Fluorescence imaging of ROS production in different cells after different treatments (scale bars: 200 µm). (F) Schematic illustration of specific switched on of PDT in tumor cells.

