Figure 4.
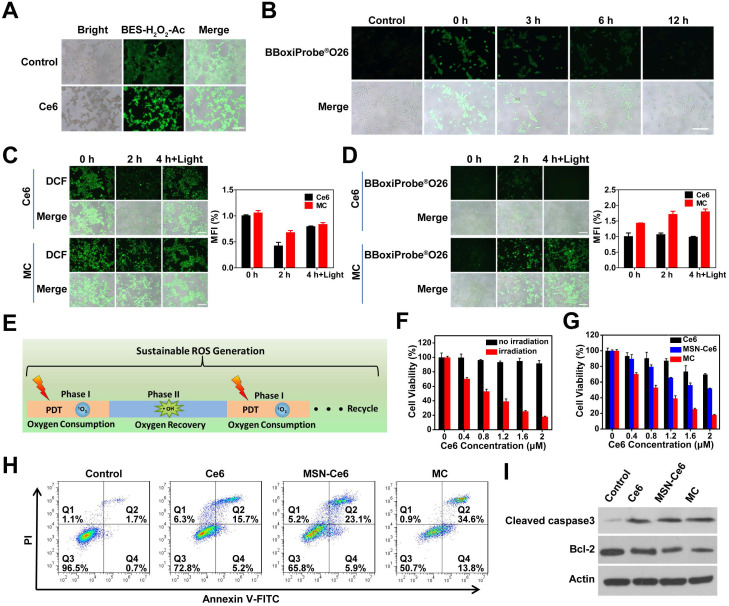
Sustainable ROS generation in 4T1 cells. (A) Fluorescence imaging of H2O2 production in 4T1 cells after different treatments (scale bar: 200 µm). (B) Fluorescence imaging of ·OH production at different time points after 4T1 cells (pretreated with 200 µM H2O2) incubated with 20 µg mL-1 Mn3O4 NPs for 4 h (scale bar: 200 µm). (C) Fluorescence imaging of ROS production in 4T1 cells at 0, 2 and 4 h after 660 nm irradiation (scale bars: 200 µm) and the corresponding mean fluorescence intensity (%) (n=3). (D) Fluorescence imaging of ·OH production in 4T1 cells at 0, 2 and 4 h after 660 nm irradiation (scale bars: 200 µm) and the corresponding mean fluorescence intensity (%) (n=3). (E) Schematic illustration of sustainable ROS generation of MC in tumor cells. (F) Cytotoxicity of MC in the presence or absence of irradiation. (G) Phototoxicity of Ce6, MSN-Ce6 and MC with Ce6 at different concentrations. (H) Flow cytometer analysis of 4T1 cells apoptosis following treatment with different preparations. (I) Western blot analysis with antibodies against cleaved caspase-3, bcl-2 and actin.

