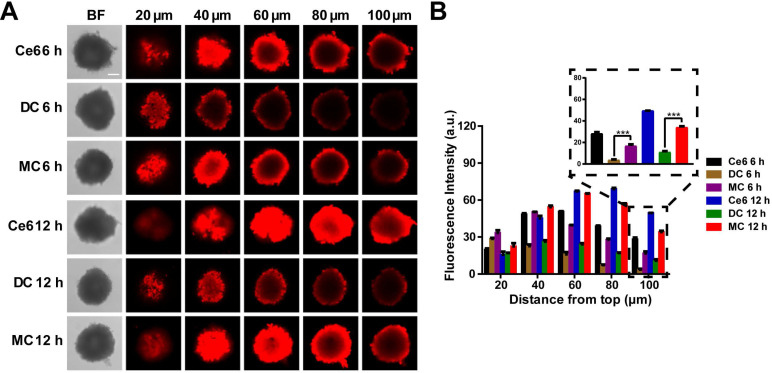
Figure 5.
In vitro 3D MCSs penetration. (A) Fluorescence imaging of the MCSs at different depths after treatment with Ce6, DC and MC for 6 h and 12 h, respectively (scale bar: 100 µm). (B) Fluorescence intensity of the MCSs at different depths after treatment with Ce6, DC and MC for 6 h and 12 h, respectively. Results are presented as means ± s.d. *P < 0.05, **P < 0.01, and ***P < 0.001 determined by Student's t test.

