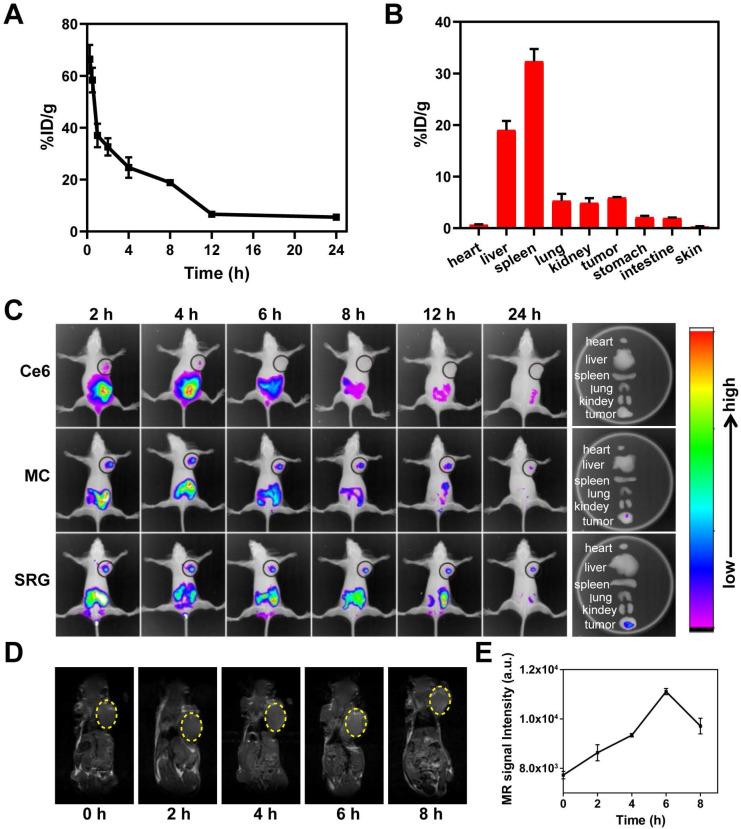
Figure 6.
In vivo imaging and behaviors of SRG. (A) Blood circulation curve of SRG by measuring the Mn2+ concentration in blood at different time points post-injection. (B) Biodistribution of SRG in mice at 12 h post-injection. The concentration of Mn2+ was measured by ICP-MS. (C) In vivo fluorescence intensity of tumor-bearing mice after intravenous injection with Ce6, MC and SRG, respectively and the corresponding fluorescence intensity of tumor and major organs at 24 h post-injection. (D) T1-weighted images of mice injected intravenously with SRG. The yellow circles indicate the tumor region. (E) Variation in the MR signals intensity in (B).

