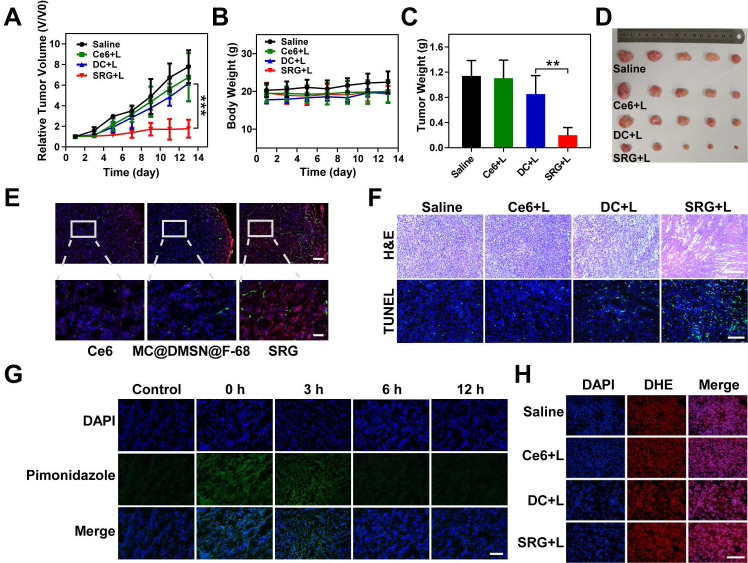
Figure 7.
In vivo PDT of SRG. (A) Tumor volume curve of mice upon different treatments (five mice for each group), Light irradiation (L) was conducted with a 660 nm laser at the power density of 0.2 Wcm-2 for 5 min. (B) Body weight curve of mice upon different treatments. (C) Weight of tumors collected from mice on the 14th day. (D) Representative photos of the ex vivo tumor. (E) Immunofluorescence staining images of frozen tumor sections. Tumor blood vessels were labeled with anti-CD31 antibody (green). Ce6 is shown in red and the nucleus in blue (DAPI) (scale bar: 100 µm). The following pictures were the enlarged parts among corresponding pictures (scale bar: 25 µm). (F) H&E and TUNEL staining of tumor tissues from different groups; scale bar (H&E): 200 µm; scale bar (TUNEL): 100 µm. (G) Immunofluorescence staining images of frozen tumor sections at different time points after PDT. The nucleus was stained with DAPI (blue), and hypoxia areas were stained with antipimonidazole antibody (green) (scale bar: 100 µm). (H) Fluorescence images of ROS production in tumor tissue. ROS is shown in red (DHE) and the nucleus in blue (DAPI) (scale bar: 100 µm). Results are presented as means ± s.d. *P < 0.05, **P < 0.01, and ***P < 0.001 determined by Student's t test.

