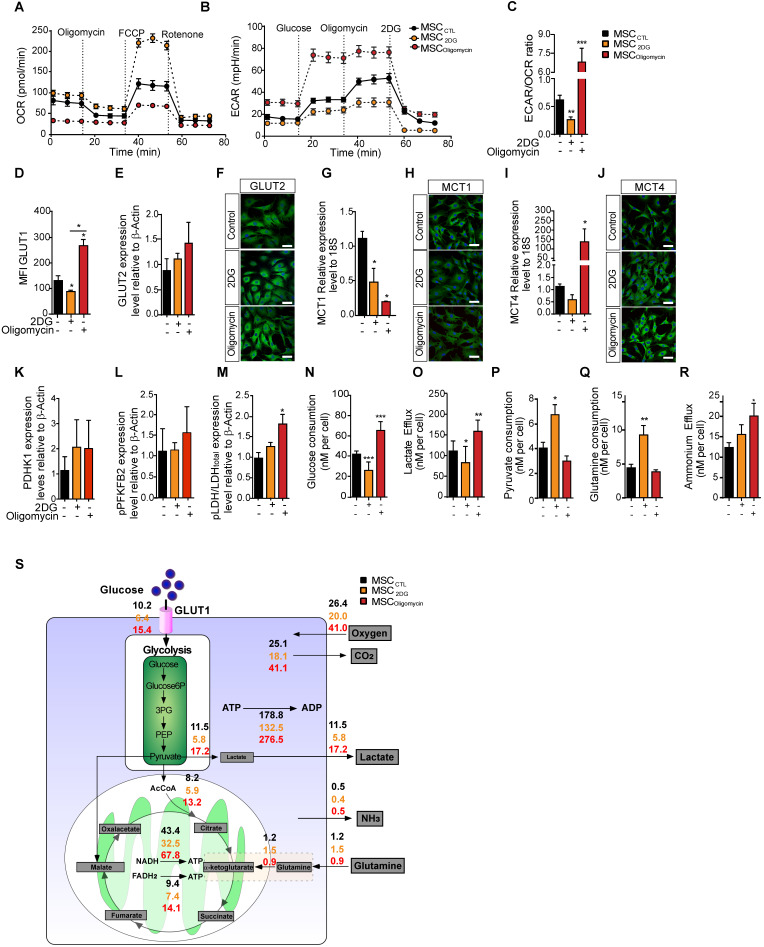
Figure 2.
In MSC, oligomycin and 2DG induce opposite metabolic profiles that replicate or prevent the metabolic switch observed upon classical cytokine stimulation. The metabolic profile of control MSC (black) or incubated with 2DG (yellow) or oligomycin (red) for 24h was evaluated by measuring the OCR (A), ECAR (B) and ECAR/OCR ratio (C) using the Agilent Seahorse XF technology. Data are the mean ± SD of at least 4 independent experiments; **: p < 0.01, *** p < 0.001, **** p < 0.0001 (unpaired Mann-Whitney test). Components of the molecular pathways associated with glycolysis or OXPHOS were analyzed in MSC incubated or not with 2DG or oligomycin for 24 h. The expression levels of the specific glucose transporters GLUT1 (D) and GLUT2 were quantified by FACS and western blotting (E) and immunofluorescence (F). The expression levels of MCT1 (G, H) and MCT4 (I, J) were quantified by qPCR and immunofluorescence. The expression levels of the glycolysis-associated enzymes PDHK1 (K), phosphorylated (p) PFKFB2 (L) and p-LDH (M) were quantified by western blotting. Glucose consumption (N), lactate efflux (O), pyruvate consumption (P), glutamine consumption (Q) and ammonium efflux (R) were quantified from the supernatants of murine MSC incubated or not with 2DG or oligomycin using an YSI analyzer. Data are the mean ± SD of at least 4 independent experiments; *: p < 0.05, **: p < 0.01, *** p < 0.001 (unpaired Kruskal-Wallis test). (S) Metabolic flux analysis by mathematical modelling of glycolysis, Krebs cycle and oxidative phosphorylation reactions that represent the cellular metabolism state.

