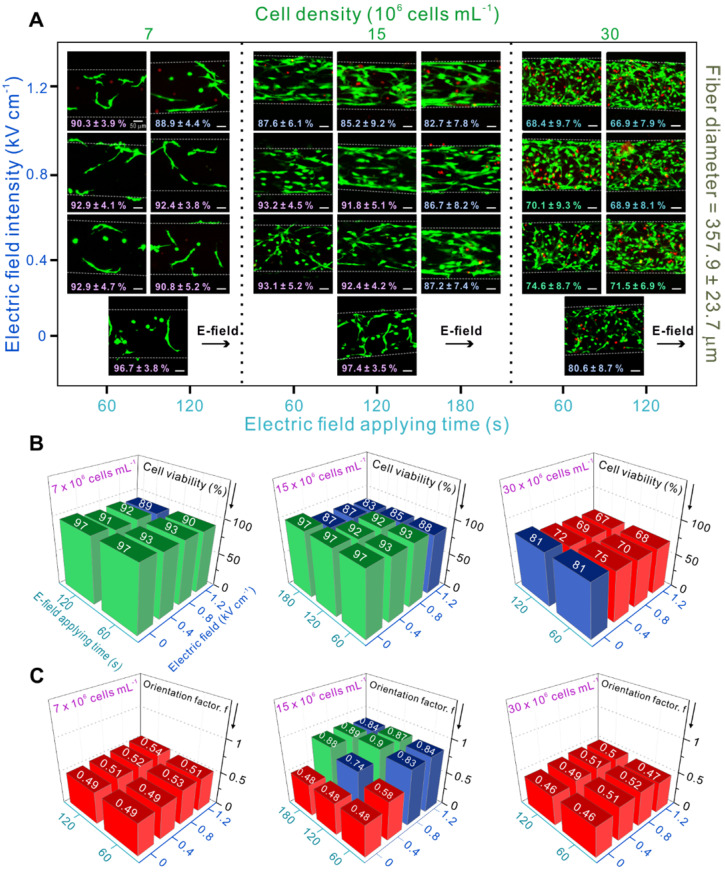
Figure 3.
(A) Live and dead images of myoblasts depending on various process parameters and the corresponding (B) cell viability (the green columns indicate cell viability > 90 %, blue columns indicate cell viability < 90 % and > 80 %, and red columns indicate cell viability < 80 %) and (C) orientation factor results (an orientation factor near value “1” indicates cell alignment in complete uniaxial direction, and the red pillars represent an orientation factor < 0.6, indicating random cell orientation).

