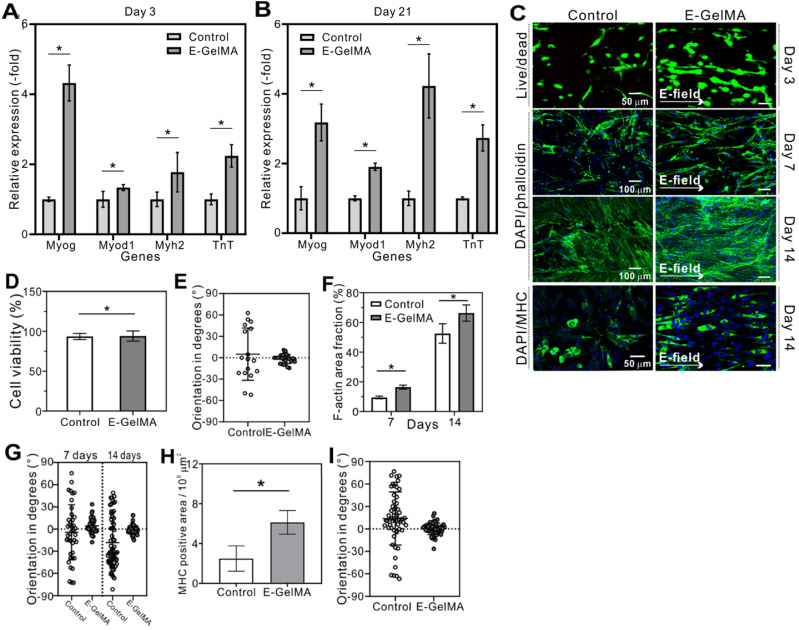
Figure 6.
Expression of myogenin, Myod, MHC, and troponin T genes after (A) 3 and (B) 21 days. (C) Fluorescence (Live/dead, DAPI-phalloidin, and DAPI/MHC staining) images of hMPCs cultured on the control and E-GelMA. (D) Cell viability and (E) cell orientation results after 3 days. (F) F-actin area coverage and (G) cell orientation results corresponding to the DAPI/phalloidin images. (H) MHC area coverage and (I) myotube orientation results corresponding to the DAPI/MHC images.

