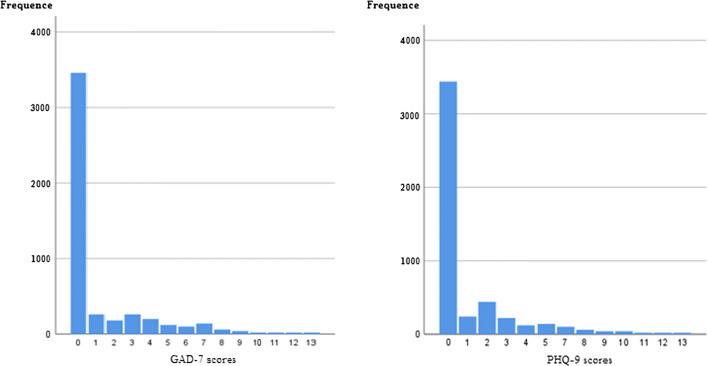
Fig. 1.
The frequency distribution of GAD-7 and PHQ-9 scores of medical imaging staff. In the figure on the left, the abscissa represents scores of the GAD-7 score table, the ordinate represents number of respondents, and the figure shows the number of people corresponding to each score; in the same way, in the figure on the right, the abscissa represents scores of the PHQ-9 score table and the ordinate represents the number of people corresponding to each score

