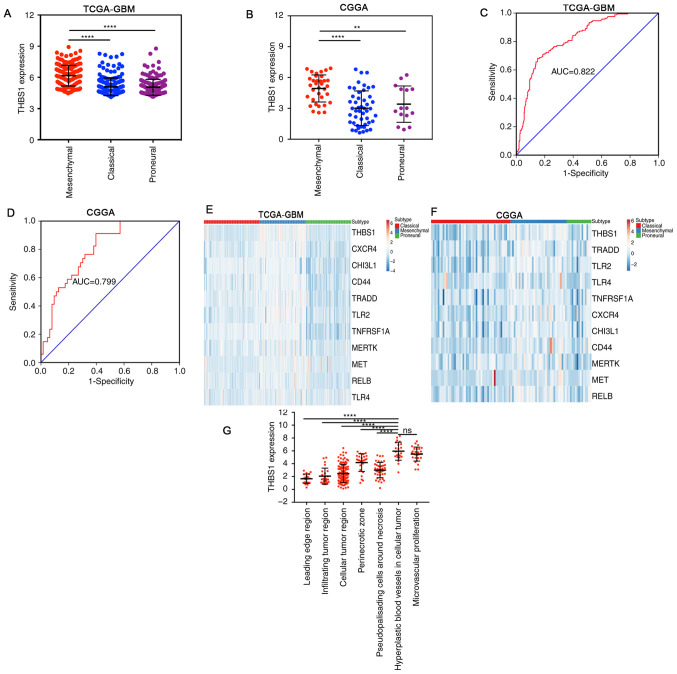
Figure 2.
High THBS1 expression predicts the mesenchymal subtype of GBM. (A,B) THBS1 expression was higher in the mesenchymal subtype of GBM compared with the other subtypes in (A) TCGA-GBM and (B) CGGA. (C and D) Receiver operating characteristic curves demonstrated high sensitivity in predicting the mesenchymal subtype, with AUC values of ~0.8 in (C) TCGA-GBM and (D) CGGA datasets. (E and F) Comparison of THBS1 expression with other mesenchymal biomarkers. (G) THBS1 expression was enriched in hyperplastic blood vessels in cellular tumors and in microvascular proliferation, as evidence by the Ivy Glioblastoma Atlas Project. **P<0.01 and ****P<0.0001. THBS1, thrombospondin-1; GBM, glioblastoma; TCGA, The Cancer Genome Atlas; CGGA, Chinese Glioma Genome Atlas; NS, not statistically significant; AUC, area under curve.

