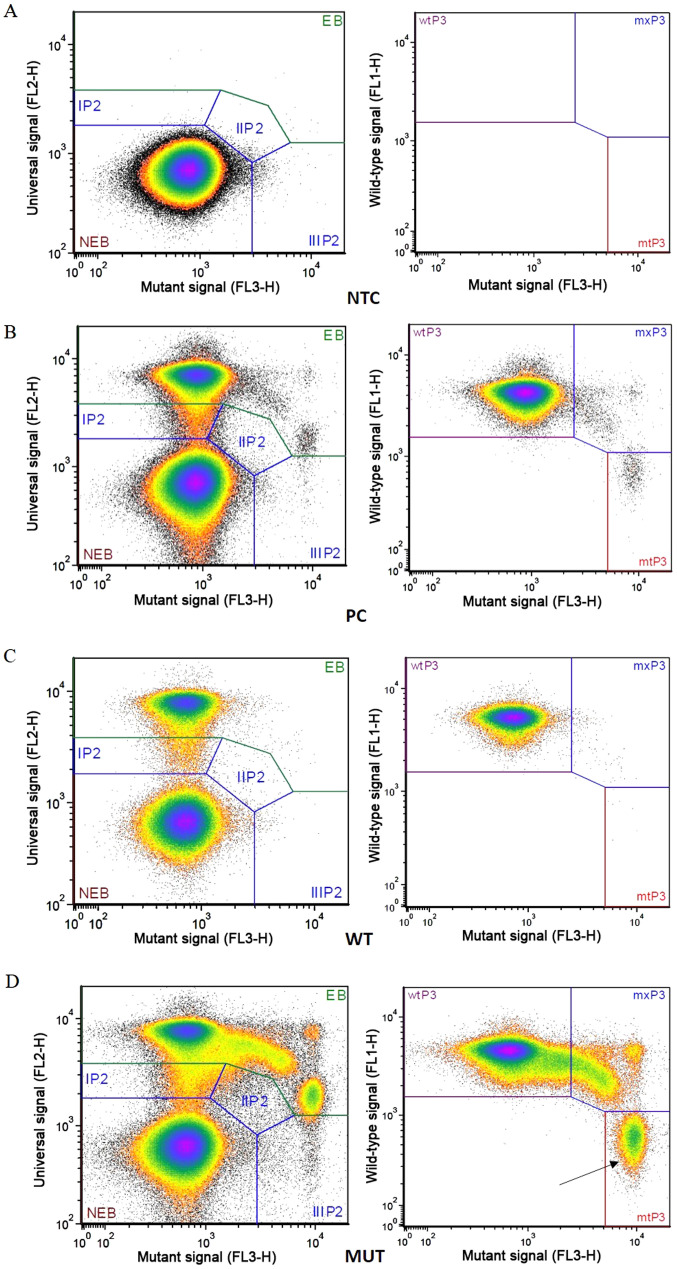
Figure 1.
Representative plots obtained by BEAMing assay. In the left plot of each panel ‘universal signal’ vs. ‘mutant signal’ is reported, whereas in the right plot, ‘wild-type signal’ vs. ‘mutant signal’ is presented. (A) Negative control; (B) PC; mutant beads, 844; mutant fraction, 0.46%; (C) WT; mutant beads, 14; mutant fraction, 0.02%; (D) MUT; mutant beads, 14,746; mutant fraction, 7.645 (see arrow). EB, extended beads; NEB, non-extended beads; wt, wild-type; mx, mutant and wild-type; mt, mutant; NTC, no template control; PC, positive control; WT, wild-type sample; MUT, mutant sample.

