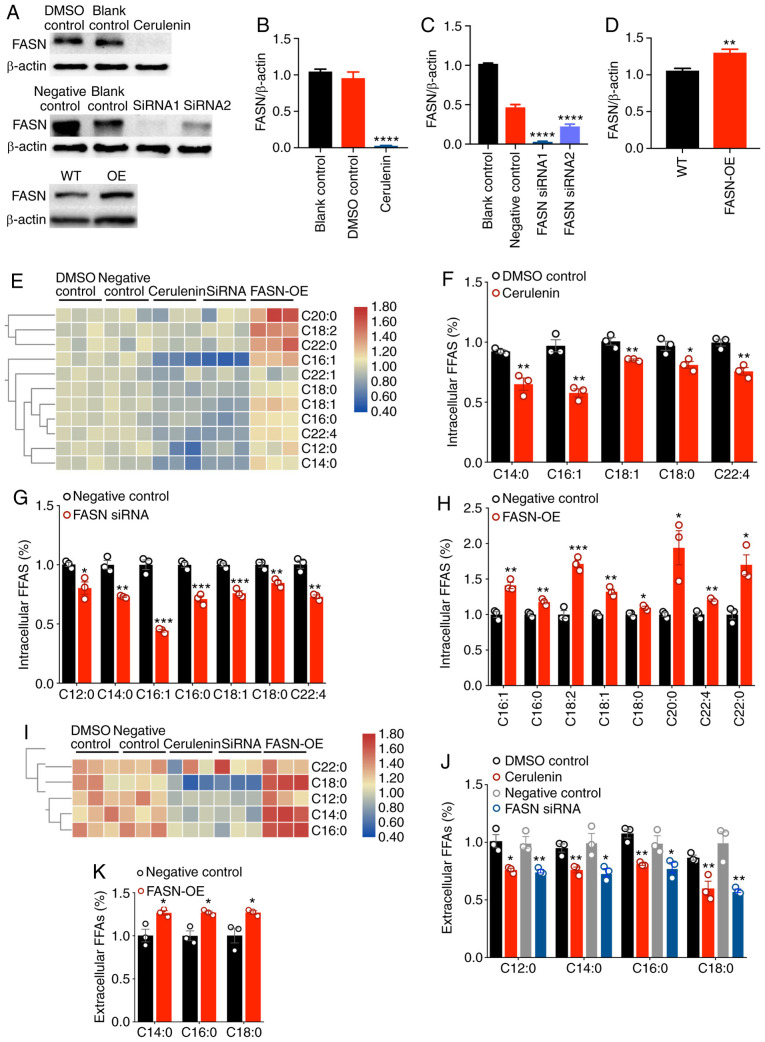
Figure 3.
The expression level of FASN affects the fatty acid content of breast cancer cells. (A-D) FASN expression was significantly decreased following cerulenin and siRNA treatment; in addition, FASN was overexpressed in SK-Br-3 cells (FASN-OE SK-Br-3 cells). Bars represent the means ± SEM (n=3); **P<0.01, ****P<0.0001 vs. control. (E) Heatmap showing the changes in fatty acids in cells following FASN knockdown and overexpression. (F) FASN was inhibited by cerulenin, and the content of 5 fatty acids in cells was decreased; columns, mean (n=3); bars, ± SEM; *P<0.05, **P<0.01 vs. DMSO control. (G) After FASN was silenced by siRNA, the content of 7 fatty acids in cells was decreased; columns, mean (n=3); bars, ± SEM; *P<0.05, **P<0.01, ***P<0.001 vs. negative control. (H) After FASN was overexpressed, the content of 8 fatty acids in cells was increased; columns, mean (n=3); bars, ± SEM; *P<0.05, **P<0.01, ***P<0.001 vs. negative control. (I) Heatmap showing the changes in extracellular fatty acids following FASN knockdown and overexpression. (J) FASN was inhibited by cerulenin and siRNA, and the content of 4 FFAs in the cell medium was reduced; columns, mean (n=3); bars, ± SEM; *P<0.05, **P<0.01 vs. control. (K) After FASN was overexpressed, the content of 3 types of FFAs in the cell medium was increased; columns, mean (n=3); bars, ± SEM; *P<0.05 vs. negative control. FASN, fatty acid synthase; FFAs, free fatty acids.

