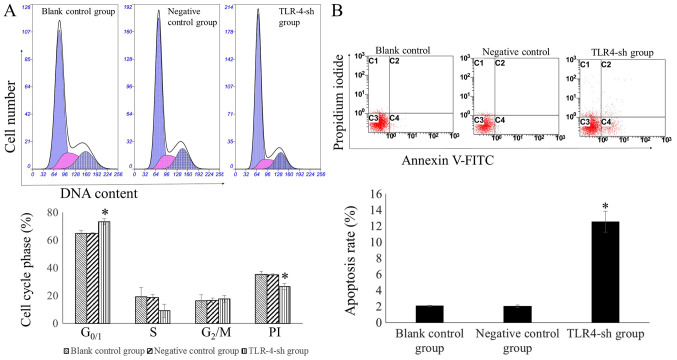
Figure 3.
Evaluation of cell cycle and apoptosis rate of transfected cells using flow cytometry. (A) Cell cycle analysis of transfected, negative control and blank control cells. Propidium iodide staining was used to determine DNA concentration. Multicycle AV software was used to perform fit analysis of the DNA cell cycle and to calculate the percentage of cells in each phase. *P<0.01 vs. blank and negative control. The percentage of G0/1 cells in the U-87MG-Sh group was significantly higher, whereas PI was significantly lower. This indicated that the proliferation activity of the U-87MG-Sh cells decreased significantly. (B) Evaluating cell apoptosis rate using flow cytometry. Measuring apoptosis rates in transfected and negative and blank control cells with flow cytometry. The apoptosis rate in the TLR4-sh group increased significantly. *P<0.01 vs. blank and negative control. TLR4, toll-like receptor 4; sh, short hairpin RNA; PI, proliferation index.

