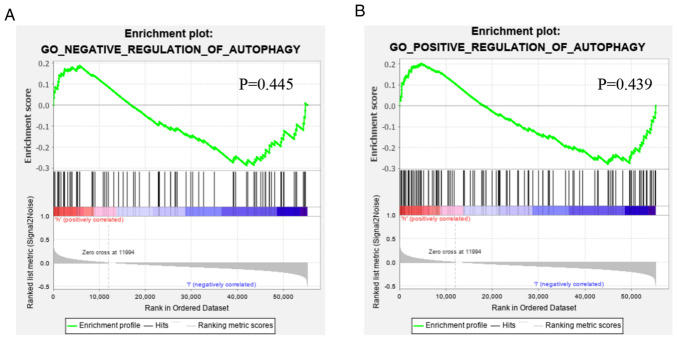
Figure 9.
Gene Set Enrichment Analysis of the difference of the autophagy status between patients in the low- and high-risk groups. The difference in gene function between low- and high-risk patients were not significantly enriched in the (A) negative or (B) positive regulation gene sets of autophagy. GO, Gene Ontology.

