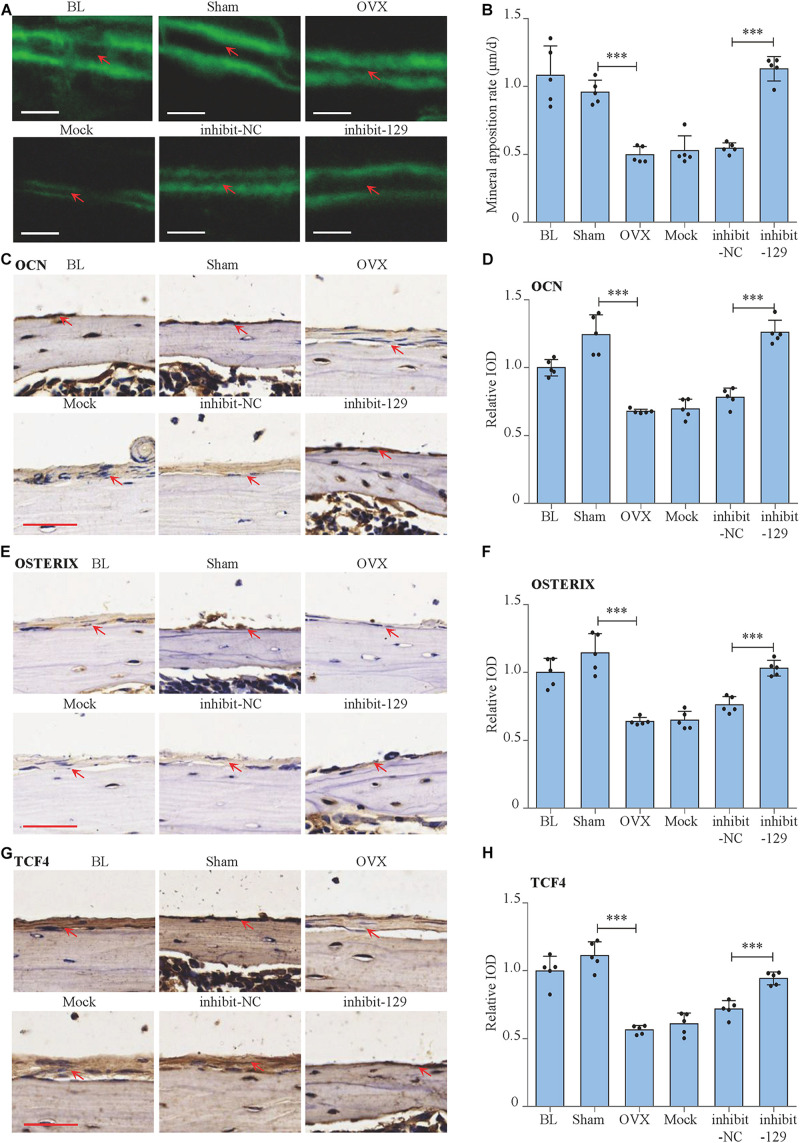
FIGURE 6.
Rescue effect of miR-129-5p inhibitor on postmenopausal osteoporosis. (A) Representative images showing calvarial mineral apposition rate of C57BL/6 mice after OVX and inhibitor-129-5p treatment. Scale bar: 10 μm. BL (baseline): sacrifice before RNA treatment. Sham: sham OVX operation group. OVX: OVX group. Mock: transfection reagent control group. inhibit-NC: inhibitor-NC–treated group. inhibit-129: inhibitor-129-5p–treated group. (B) Calvarial mineral apposition rates of C57BL/6 mice after OVX and inhibitor-129-5p treatment (mean ± SD, ∗∗∗P < 0.001). (C) Expression of OCN in calvarial tissues of C57BL/6 mice after OVX and inhibitor-129-5p treatment, as detected by immunohistochemical staining. Scale bar: 50 μm. (D) Quantification of relative integrated optical density (IOD) values of OCN immunostaining using Image-Pro Plus 6.0 software (mean ± SD, ∗∗∗P < 0.001). (E) Expression of OXTERIX in calvarial tissues of C57BL/6 mice after OVX and inhibitor-129-5p treatment, as detected by immunohistochemical staining. Scale bar: 50 μm. (F) Quantification of relative IOD values of OXTERIX immunostaining using Image-Pro Plus 6.0 software (mean ± SD, ∗∗∗P < 0.001). (G) Expression of RUNX2 in calvarial tissues of C57BL/6 mice after OVX and inhibitor-129-5p treatment, as detected by immunohistochemical staining. Scale bar: 50 μm. (H) Quantification of relative IOD values of RUNX2 immunostaining using Image-Pro Plus 6.0 software (mean ± SD, ∗∗∗P < 0.001).

