Abstract
Background and Aims:
Most patients with cirrhosis induced by chronic HBV infection experience fibrosis regression after long-term antiviral treatment, while some remain cirrhotic. Fibrosis regression is associated with lower odds of developing hepatic decompensation and hepatocellular carcinoma, but mechanisms impacting differential fibrosis regression between individuals are unclear. We asked whether soluble molecules, including serum microRNAs, could serve as biomarkers of fibrosis regression.
Methods:
We analyzed cryopreserved sera from clinical trials in which cirrhotic HBV-infected patients (baseline Ishak fibrosis score of 5-6) received 240 weeks of nucleotide analogue treatment. Liver biopsies at week 240 in these trials showed 71/96 patients (74%) had fibrosis regression (Ishak ≤ 4) while 25/96 (26%) remained cirrhotic (Ishak 5-6). We quantified inflammatory markers (CXCL10, soluble CD163) and miRNAs (n=179) from serum at baseline, week 48, and week 240 of treatment in a sub-cohort of patients with (n=14) or without (n=14) fibrosis regression.
Results:
CXCL10, sCD163, and miRNAs previously associated with HBV replication and inflammation decreased during treatment but did not differ based on fibrosis regression. Two miRNAs (miR-421, miR-454-3p) had lower baseline expression in patients with subsequent fibrosis regression. 27 miRNAs differed at week 240 and had higher expression in patients with fibrosis regression (e.g. miR-199a-3p, miR-423-3p, miR-142-3p, miR-let-7d-5p). Several miRNAs (miR-141-3p, let-7d-5p) that correlated with regression have previously been implicated in the pathophysiology of non-alcoholic steatohepatitis.
Conclusions:
In cirrhotic patients with chronic HBV infection treated with antiviral therapy, serum miRNAs have differential expression based on fibrosis regression, suggesting potential utility as biomarkers.
Keywords: hepatitis B virus, tenofovir, inflammation, biomarker, antiviral therapy
Introduction
Chronic viral hepatitis infections cause significant morbidity and mortality and are the 7th leading cause of death worldwide. Globally, over 240 million people have chronic hepatitis B virus (HBV) infection, including approximately 850 thousand people in the United States (1-4). In addition to imparting an elevated risk for developing hepatocellular carcinoma (HCC), mortality from untreated chronic HBV infection results from progressive hepatic fibrosis leading to complications of end-stage liver disease. Long-term suppression of HBV replication with potent antiviral medications that have a high genetic barrier to resistance lowers the risk of hepatic decompensation and HCC and can facilitate regression of hepatic fibrosis in most, but not all patients (5, 6).
Population heterogeneity in fibrosis regression during HBV treatment was demonstrated in two multi-center, international, phase 3 clinical trials (NCT00117676 and NCT00116805). In these trials, 641 patients with chronic HBV infection were treated with 48 weeks of tenofovir disoproxil fumarate (TDF) or adefovir (ADV), 585 (91%) of whom entered an open-label extension phase at week 48 with continued TDF, and 489 patients (76%) of whom completed 240 weeks of treatment (5). In 348 patients with paired liver biopsies collected at baseline and at week 240, 87% had histologic improvement in inflammation and the majority (51%) had regression of fibrosis, including 71 of 96 (74%) patients with baseline cirrhosis (5). In contrast, only 3 of 252 patients without cirrhosis at baseline progressed to cirrhosis by week 240 (5). In a multivariate analysis of baseline and on-treatment factors, only higher body-mass index (BMI) was associated with lack of fibrosis regression, and no other clinical factors distinguished the groups. In a subsequent analysis, hepatic steatosis and eAg status were shown to correlate with a persistent increase in ALT at the end of treatment (5, 7).
The ability to predict fibrosis regression has clinical significance as patients without regression likely require more aggressive longitudinal surveillance for the complications of advanced liver disease, including HCC. Additionally, understanding mechanisms of differential fibrosis regression are important when considering novel therapeutic approaches to pharmacologically induce regression. Using this well-defined clinical cohort, we explored mechanisms of differential fibrosis regression by analyzing cryopreserved serum and asking whether soluble noninvasive biomarkers correlated with fibrosis regression.
Serum microRNAs (miRNAs) have established potential as diagnostic biomarkers of disease, and levels of specific miRNAs have been associated with hepatic fibrosis, HBV infection, and HCC (8-10). Most studies examining miRNAs in correlation with hepatic fibrosis have been cross-sectional comparing patients with differing degrees of fibrosis and healthy controls, while few studies have examined longitudinal samples from defined cohorts with documented changes in fibrosis over time. In this unique cohort of patients with a defined histologic response to 240 weeks of nucleotide analogue therapy, we tested the hypothesis that serum miRNAs could be used to monitor or predict fibrosis regression. A secondary goal was to identify miRNAs with the potential to mechanistically relate to fibrosis regression, and thus identify novel pathways to consider for pharmacologic approaches to target fibrosis. For comparison, we also quantitated serum levels of CXCL10 (an inflammatory chemokine) and sCD163 (a marker of macrophage activation) which have previously been associated with HBV replication and fibrosis stage and which have been shown to decrease during antiviral suppression of HBV replication (11, 12).
Materials and Methods
Clinical Samples
Cryopreserved serum samples from cirrhotic HBV-infected patients (baseline Ishak fibrosis score = 5-6) treated with nucleotide analogs (TDF or ADV for 48 weeks followed by open-label TDF until week 240) in clinical trials NCT00117676 and NCT00116805 were used in this study (5). We defined subjects with an Ishak fibrosis score of 2-3 on their week 240 liver biopsy as the “fibrosis regression” cohort), while subjects with an Ishak fibrosis score of 5-6 at week 240 were defined as the “no fibrosis regression” cohort. Subjects included in this sub-study were selected based on availability of cryopreserved serum at baseline, week 48 of treatment, and week 240 of treatment in the “no fibrosis regression” group, which yielded a sample size of 14. These were then matched 1:1 with subjects in the “fibrosis regression” cohort based on gender, age, HBV eAg status, alanine transaminase (ALT) normalization at week 240, and hepatic steatosis on baseline liver biopsies (Table 1). All 28 subjects achieved on-treatment virologic suppression of HBV replication as measured by a plasma DNA assay (HBV DNA <69 IU/mL; Roche COBAS Taqman Assay, Roche Molecular Systems, Branchburj, NJ) (5). No patient had more than grade 1 hepatic steatosis on baseline liver biopsies, and BMI and baseline histologic necroinflammatory activity were similar between the groups (Table 1). Use of these previously collected, de-identified samples for this laboratory analysis was approved by the Medical University of South Carolina Institutional Review Board, patients in the initial trials consented for stored samples to be used in future studies, and experiments were performed in accordance with the ethical standards of the Helsinki Declaration of 1975, revised in 1983.
Table 1:
Baseline cohort characteristics.
| Fibrosis Regression |
No Fibrosis Regression |
|
|---|---|---|
| Gender (male/female) | 12/2 | 12/2 |
| Mean Age (range) | 51 (37-61) | 51 (37-64) |
| HBeAg status (+/−) | 3/11 | 2/12 |
| Baseline ALT (> upper limit of normal) | 14 | 14 |
| Week 240 ALT (> upper limit of normal) | 1 | 2 |
| Mean Ishak Fibrosis Score (range): | ||
| Baseline | 5.9 (5-6) | 5.9 (5-6) |
| Week 48 | 5.0 (3-6) | 5.8 (4-6) |
| Week 240 | 2.7 (2-3) | 5.9 (5-6) |
| *Baseline Steatosis (+/−) | 4/10 | 5/9 |
| Mean BMI (range) | 27.3 (22.7-34.7) | 27.5 (22.6-35.2) |
| Baseline Knodell Necroinflammatory Score (>=3/<3) | 14/0 | 14/0 |
ALT: alanine aminotransferase
No patient had more than stage 1 steatosis at baseline
Serum Analysis
CXCL10 and soluble CD163 (sCD163) were quantitated by ELISA according to the manufacturer’s instructions (R&D Systems). Multiple sCD163 values at baseline were above the upper limit of detection of the assay, and are reported as such, but insufficient serum remained for repeat assay with dilution.
miRNAs were extracted from serum using the Exiqon miRCURY RNA Isolation Kit for Biofluids, according to the manufacturer’s instructions, which isolates all miRNAs within the sample. Isolated miRNAs were polyadenylated and reverse transcribed into cDNA in a single reaction step using the miRCURY LNA Universal RT approach. The miRCURY LNA Universal RT microRNA PCR serum/plasma focus panel was used, encompassing 179 unique miRNA species, with a single replicate performed for each assay. To address potential variation in the experiment, two sets of internal control miRNA and a negative control were included. Amplification was performed with a Roche Lightcycler 480. Raw Ct values and melting points were detected using Lightcycler software and exported. Assays with several melting points, or melting points deviating from assay specifications, were flagged and removed. Reactions with an amplification efficiency below 1.6 were removed. Assays in which the raw Ct value of over half of the samples were within 5 Cq values of the negative control sample were removed (miR-125a-5p, miR-2110, miR-326, miR-483-5p). Samples with hemolysis, based on having a delta Ct of (miR-23a-3p – miR-451a) of ≥7, per Exiqon’s serum miRCURY protocol, were excluded (n=3). Data reported for each individual miRNA at each time point were derived from up to 14 individual patients in each cohort, and 45 miRNAs were present in all samples. Because multiple miRNA species were not detectable in all patients, some analyses include less than 14 data points per cohort per time point.
Statistical Analysis
Ct values of miRNAs were normalized by the global mean method, chosen based on analysis of the data by Exiqon NormFinder which identified this as the approach providing the most normal stabilization, wherein the normalization target for each sample was the arithmetic mean of the raw Ct values from all miRNAs within that sample. This method has been shown to be stable and versatile, especially when reference miRNAs are unknown or unavailable (13). Comparison of the global mean with the mean of five reference miRNAs previously suggested for use in miRNA serum analysis in HBV samples yielded a strong correlation (Pearson correlation coefficient 0.93, P-value < 10−16) (14). Statistical analysis was performed using SAM (Significance Analysis of Microarrays; package samr version 2.0) in R (version 3.3.0). Missing values were imputed by k-nearest neighbor’s algorithm, which is built in the samr package. The false discovery rate (FDR) was computed by permutation test, in which the labels of samples were randomly shuffled for each permutation. An FDR cutoff of 0.10 was used as the threshold of significance. For individual miRNAs, the area under the receiver-operator curve (AUC) was calculated using normalized values of each miRNA to assess capacity to distinguish the cohorts. Random forest modeling was used to classify cohorts based on groups of miRNAs.
Results
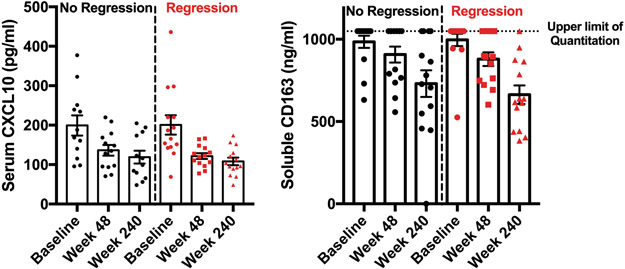
Baseline demographic and clinical characteristics of patients whose samples were selected for analysis are shown in Table 1, with no significant differences identified between the regression and non-regression cohorts. We first quantitated the serum markers CXCL10 and sCD163, previously shown to correlate with HBV replication and fibrosis and which decrease with treatment (11, 12), in order to establish the overall trajectory of changes in inflammation over the course of treatment. We verified that CXCL10 and sCD163 both decreased during HBV treatment in this cohort and that this decline occurred in both patient cohorts and did not correlate with fibrosis regression (Figure 1). A noticeable reduction in both CXCL10 and sCD163 levels was observed by week 48 of treatment (Figure 1), at a time when there had not yet been significant histologic fibrosis of regression (Table 1) but when there had been improvement in hepatic transaminase levels.
Figure 1:
CXCL10 (A) and soluble CD163 (B) decrease during treatment in both the no regression (n=14) and regression cohorts (n=14). Both changed significantly over the course of treatment in each cohort (p<0.05 on one-way ANOVA) but did not differ between cohorts. The upper limit of quantitation for the sCD163 assay is shown, with multiple values above the upper limit of detection, as described in the methods.
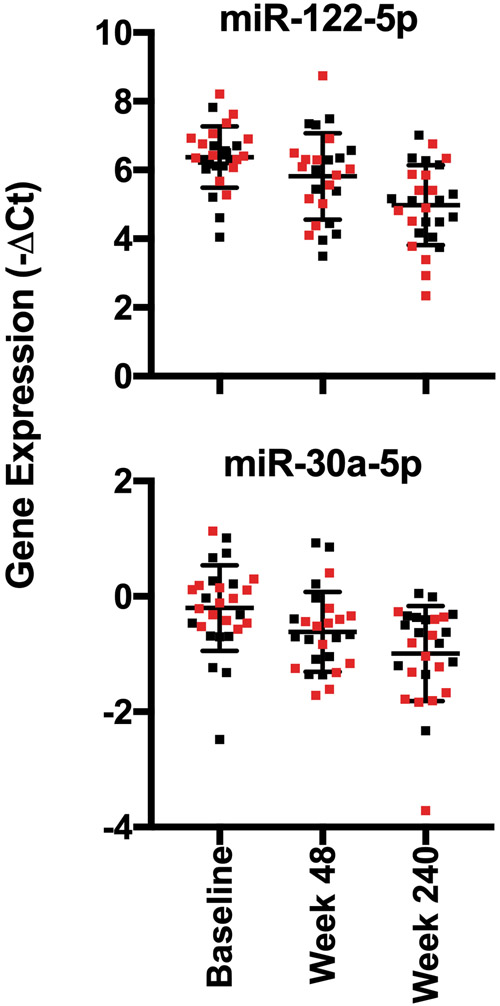
We next performed quantitative PCR of 179 miRNAs in serum and detected an average of 159 species per sample, including 45 miRNAs that were detected in all samples. The arithmetic mean of the samples did not differ between the cohorts at any time point. A total of 18 miRNAs changed significantly in the entire cohort over time when considering all 3 time points (Spearman correlation test, P < 0.05) (Table 2), but none of these individual miRNA with differential change over time was specific to the fibrosis regression group (data not shown). Consistent with previous findings (15), we found that miRs 122-5p, 125b-5p, 192-5p, and 194-5p all decreased in serum over the course of treatment (Table 2, Figure 2).
Table 2:
miRNAs that change over time in the entire cohort
| miRNAs Decreased with Treatment | miRNAs Increased with Treatment | ||||
|---|---|---|---|---|---|
| miRNA | Spearman rho | P-value | miRNA | Spearman rho | P-value |
| 34a-5p | −0.62 | 4.6 × 10⁻⁷ | 374a-5p | 0.31 | 3.4 × 10⁻² |
| 885-5p | −0.53 | 1.8 × 10⁻⁵ | 423-5p | 0.31 | 3.2 × 10⁻² |
| 122-5p | −0.47 | 3.4 × 10⁻⁴ | 106b-5p | 0.32 | 2.7 × 10⁻² |
| 215-5p | −0.45 | 5.6 × 10⁻⁴ | 363-3p | 0.32 | 2.9 × 10⁻² |
| 148a-3p | −0.44 | 9.7 × 10⁻⁴ | 140-5p | 0.35 | 1.2 × 10⁻² |
| 100-5p | −0.42 | 1.5 × 10⁻³ | 18a-5p | 0.36 | 8.2 × 10⁻³ |
| 125b-5p | −0.4 | 2.9 × 10⁻³ | 93-5p | 0.39 | 3.8 × 10⁻³ |
| 192-5p | −0.4 | 3.5 × 10⁻³ | 106a-5p | 0.4 | 2.7 × 10⁻³ |
| 30a-5p | −0.4 | 2.7 × 10⁻³ | |||
| 194-5p | −0.38 | 5.6 × 10⁻³ | |||
Shown are miRNAs with significantly different expression at week 240 relative to week 0 considering all 28 patients.
Figure 2:
Graphical depiction of representative miRNAs (miR-122-5p and miR-30a-5p) that change during treatment irrespective of fibrosis regression. Data from patients with fibrosis regression are shown in red and from patients with no fibrosis regression are shown in black. P-values for this analysis are shown in Table 2.
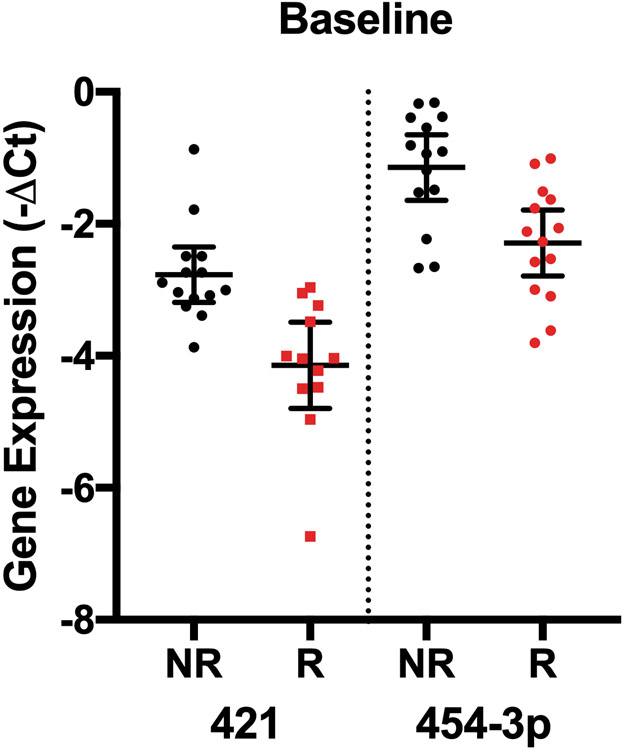
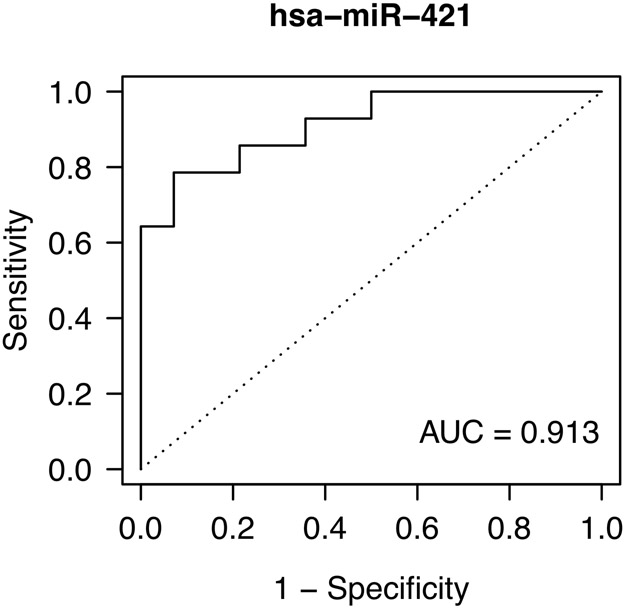
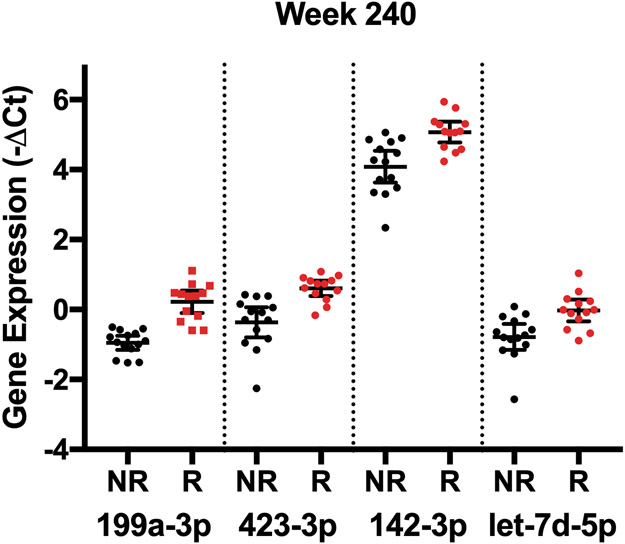
We next determined whether any individual miRNAs had differential expression based on fibrosis regression at specific time points in a cross-sectional analysis. When miRNAs were analyzed at each time point between the cohorts, we identified two miRNAs that differed at baseline (miR-421, miR-454-3p), none that differed at week 48, when fibrosis had not changed significantly (Table 1), and 27 that differed at week 240 (Table 3, Figure 3). Based on AUC values, we identified miR-421 at baseline and miR-199a-3p at week 240 as the species with the highest predictive power to distinguish the fibrosis regression groups (Table 3, Figure 3). No combination of miRNA species, however, was found to improve the predictive capacity of these individual species.
Table 3:
miRNAs with differential expression based on fibrosis regression.
| microRNA | Time point | SAM Score | Fold Difference | FDR | AUC |
|---|---|---|---|---|---|
| 421 | Baseline | −1.86 | −2.50 | 0.00 | 0.91 |
| 454-3p | Baseline | −1.47 | −2.22 | 0.00 | 0.83 |
| 199a-3p | Week 240 | 2.06 | 2.26 | 0.00 | 0.97 |
| 423-3p | Week 240 | 1.87 | 1.96 | 0.00 | 0.92 |
| 142-3p | Week 240 | 1.65 | 1.99 | 0.00 | 0.87 |
| let-7d-5p | Week 240 | 1.55 | 1.69 | 0.00 | 0.85 |
| 221-3p | Week 240 | 1.55 | 1.77 | 0.00 | 0.85 |
| 339-5p | Week 240 | 1.48 | 2.12 | 0.00 | 0.84 |
| 103a-3p | Week 240 | 1.43 | 1.64 | 0.00 | 0.82 |
| 142-5p | Week 240 | 1.43 | 1.70 | 0.00 | 0.82 |
| 107 | Week 240 | 1.41 | 1.50 | 0.00 | 0.82 |
| 331-3p | Week 240 | 1.38 | 1.47 | 0.00 | 0.81 |
| 199a-5p | Week 240 | 1.33 | 1.86 | 0.00 | 0.80 |
| 339-3p | Week 240 | 1.33 | 1.62 | 0.00 | 0.80 |
| let-7f-5p | Week 240 | 1.29 | 1.78 | 0.00 | 0.79 |
| 128-3p | Week 240 | 1.29 | 1.84 | 0.00 | 0.79 |
| 130a-3p | Week 240 | 1.29 | 1.65 | 0.00 | 0.79 |
| 652-3p | Week 240 | 1.29 | 1.47 | 0.00 | 0.79 |
| 148b-3p | Week 240 | 1.24 | 1.35 | 0.00 | 0.78 |
| 151a-5p | Week 240 | 1.24 | 1.66 | 0.00 | 0.78 |
| let-7a-5p | Week 240 | 1.14 | 1.52 | 0.04 | 0.76 |
| 151a-3p | Week 240 | 1.14 | 1.54 | 0.04 | 0.76 |
| 328-3p | Week 240 | 1.14 | 1.77 | 0.04 | 0.76 |
| 146a-5p | Week 240 | 1.12 | 1.54 | 0.04 | 0.75 |
| 140-5p | Week 240 | 1.09 | 1.40 | 0.04 | 0.75 |
| 28-5p | Week 240 | 1.09 | 1.45 | 0.04 | 0.75 |
| 495-3p | Week 240 | 1.04 | 1.86 | 0.06 | 0.74 |
| 374b-5p | Week 240 | 1.02 | 1.40 | 0.06 | 0.73 |
| 376c-3p | Week 240 | 1.02 | 1.81 | 0.06 | 0.73 |
Raw significance analysis of microarray (SAM), fold difference, false discover rate (FDR), and area under the curve (AUC) data for each miRNA species that differ at individual time points between patient cohorts. Negative SAM scores reflect lower expression in the fibrosis regression group, while positive SAM scores reflect higher relative expression in the fibrosis regression group. An FDR of < 0.10 was used for significance.
Figure 3:
miRNA species with differential expression at individual time points between patients with no fibrosis regression (NR) and patients with fibrosis regression (R). A) Expression of the two miRNAs with the greatest differential expression between groups at baseline. B) Predictive capacity of miR-421 expression at baseline shown by AUC analysis. C) Expression of the top 4 miRNAs with the greatest differential expression between groups at week 240 of treatment. All displayed species had significantly different expression between the groups based on having an FDR < 0.10.
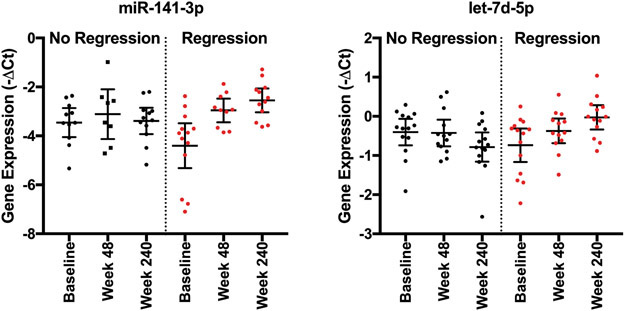
Our analysis did not identify any species with consistent longitudinal changes at all three time points between the fibrosis cohorts, which could relate to missing data from incomplete detection of miRNA species at all time points in all samples. We thus analyzed longitudinal differences in miRNA expression between the cohorts using paired data comparing either week 48 or week 240 expression to baseline expression. Such a comparison of internal patient changes allows identification of miRNAs that may specifically relate to fibrosis regression as it controls for patient to patient variability in baseline expression. This analysis identified multiple miRNA species that had differential change over time between the two patient cohorts (Table 4, Figure 4, Supplemental Table 1), with miR-141-3p and let-7d-5p having the highest AUC values. miR-141-3p has previously been associated with NASH, with loss associated with amelioration of hepatic steatosis and expression associated with inhibition of HBV replication (16, 17). Low levels of let-7d-5p have been associated with progressive hepatic fibrosis in HCV infection (18). These data suggest these two miRNAs warrant further study to explore their mechanistic relationship to fibrosis regression.
Table 4:
miRNAs with differential change during treatment based on fibrosis regression.
| microRNA | Time point | SAM Score |
FDR | AUC |
|---|---|---|---|---|
| 421 | Baseline-Week 48 | 1.68 | 0.00 | 0.89 |
| 141-3p | Baseline-Week 240 | 1.55 | 0.06 | 0.85 |
| let-7d-5p | Baseline-Week 240 | 1.41 | 0.06 | 0.82 |
| 142-3p | Baseline-Week 240 | 1.26 | 0.06 | 0.79 |
| 103a-3p | Baseline-Week 240 | 1.19 | 0.06 | 0.77 |
| 18a-5p | Baseline-Week 240 | 1.19 | 0.06 | 0.77 |
| 199a-3p | Baseline-Week 240 | 1.19 | 0.06 | 0.77 |
| 107 | Baseline-Week 240 | 1.17 | 0.06 | 0.76 |
| 374b-5p | Baseline-Week 240 | 1.09 | 0.06 | 0.75 |
| 454-3p | Baseline-Week 240 | 1.09 | 0.06 | 0.75 |
| let-7f-5p | Baseline-Week 240 | 1.07 | 0.06 | 0.74 |
| 18b-5p | Baseline-Week 240 | 1.07 | 0.06 | 0.74 |
| 423-3p | Baseline-Week 240 | 1.07 | 0.06 | 0.74 |
Raw significance analysis of microarray (SAM), false discover rate (FDR), and area under the curve (AUC) data for each miRNA based on the change over time. The time point column indicates the time frame examined for change in miRNA expression identified to have an FDR <0.1 between the 2 patient groups. A positive SAM score indicates greater relative change in miRNA expression in patients who experienced fibrosis regression.
Figure 4:
Representative miRNA species with significantly different increases in expression in patients with fibrosis regression between baseline and week 240. P-values for this analysis are shown in Table 4.
Discussion
This analysis identified multiple miRNAs before and after 5 years of treatment with nucleotide analogs that correlate with fibrosis regression in cirrhotic HBV-infected patients. While suppression of HBV replication in these trials resulted in regression of hepatic fibrosis in most patients, not all patients experienced fibrosis regression, and only elevated BMI correlated with lack of fibrosis regression in a prior multivariate analysis. This study of patient serum now identifies potential biomarkers of fibrosis regression and adds insight into the potential mechanisms for this heterogeneous clinical outcome. miRNAs previously associated with HBV replication levels decreased in our study (Table 2) (15), providing validity that miRNAs of relevance can be detected in patient serum and can reflect intrahepatic events (9, 19).
Interestingly, miR-421 had differential expression at baseline and has previously been implicated in the pathophysiology of NASH in animal models of liver disease, as up-regulation of miR-421 was observed in a mouse model of NAFLD, with functional links to oxidative stress and lipid metabolism identified (20). Considered with the clinical observation that higher BMI, presence of diabetes, and persistent hepatic inflammation after treatment correlated with lack of fibrosis regression in the original trials (5, 7), this raises the intriguing prospect that patients with a component of underlying metabolic liver disease, in addition to HBV-induced liver disease, may be at the greatest risk for lack of fibrosis regression during nucleotide analogue treatment.
While CXCL10 and sCD163 have both previously been associated with HBV DNA replication and fibrosis stage (12), this study showed that both analytes decreased during treatment irrespective of fibrosis regression, suggesting these markers may be a better reflection of hepatic inflammation than fibrosis stage. This was suggested by the observation that levels of both were reduced at week 48 of treatment when there was not yet a significant histologic change in fibrosis (Table 1, Figure 1). The relationship between hepatic fibrosis, hepatic inflammation, and hepatic stellate cell activation in relation to fibrosis regression is an area of active an ongoing research (21, 22). Also of interest is that miRNAs previously associated with advanced hepatic fibrosis, including miR-21, miR-29, and miR-155 (23), were not significant species identified in our study as differing between fibrosis regression cohorts. The relevance of these miRNAs as correlates of fibrosis stage and predictors of fibrosis regression merits further study (24). As an example, miR-21, associated with liver fibrosis based on patient samples and mouse studies, was not found to have a significant impact on fibrosis when modulated in stellate cells and mouse models of fibrosis (25, 26).
We also compared our results to other recently reported miRNA-HBV studies. A prior cross-sectional analysis of serum and liver biopsy miRNAs based on stage of HBV identified multiple miRNAs associated with inflammatory and fibrosis stage (9). Due to different techniques between these studies, multiple significant miRNAs identified in their analysis were not present on our serum miRNA panel, preventing a direct comparison of the results. Of the 4 miRNAs whose serum levels were elevated in advanced fibrosis in their study and which were present on our miRNA panel (miRs-10b-5p, −1, −133b, −20b-5p), none was found to be differentially expressed in our study when comparing baseline or week 240 levels based on fibrosis regression (9). In another cross sectional analysis of miRNAs in serum that differed by fibrosis stage, 3 had lower relative expression with good predictive value for advanced fibrosis (miRs-29a, −143, −223), but none were identified as significantly different in our analysis (10). Different techniques and approaches to miRNA detection, as well as the cross-sectional versus longitudinal nature of the study designs, may have contributed to these different findings.
Limitations of the study include lack of availability of a validation cohort to independently test the predictive capacity of the identified miRNAs. Due to the small sample size of the study, while we did match for important patient characteristics at baseline (Table 1), we were unable to control for other potential confounders. While serum samples were, in some cases, cryopreserved for over a decade, previous work has suggested stability of miRNAs in cryopreserved serum over time (27), and our data analysis included rigorous quality controls to exclude samples of low quality. While use of technical replicates to control for assay variability would have been ideal, our study used only a single technical replicate for miRNA quantitation based on limited sample availability. Finally, because we are unable to distinguish hepatic vs. extra-hepatic production of the miRNAs measured in this study, this tempers the suggestion that the identified species could be amenable to pharmacologic targeting in the liver to modulate fibrosis regression.
With the improved capacity of advanced imaging modalities to stage liver disease, the need to identify biomarkers of fibrosis regression may be less clinically urgent, but studies such as these remain important to glean insight into putative mechanisms of fibrosis regression. The potential for miRNAs to serve as viable clinical targets for pharmacotherapy was best illustrated when administration of an miR-122 antagonist was shown to significantly decrease HCV replication in a clinical trial (28).
In conclusion, this analysis of miRNAs in serum identified multiple species with differential baseline or end-of-treatment expression in cirrhotic HBV-infected patients treated for 5 years with TDF based on fibrosis regression. Several of the identified miRNAs have previously been associated with fatty liver disease, suggesting that underlying metabolic disease could relate to impaired fibrosis regression during HBV suppression.
Supplementary Material
Lay Summary/Key Points.
Regression of hepatic fibrosis in HBV-infected persons with cirrhosis who receive long-term antiviral therapy treated is not uniform.
This work identifies multiple miRNA species whose longitudinal expression correlates with fibrosis regression during antiviral treatment of cirrhotic HBV-infected patients.
The identified miRNAs have potential utility as clinical biomarkers and may provide insight into mechanisms of differential fibrosis regression.
Acknowledgments:
The authors would like to thank the investigators and participants who participated in the clinical trials from which the samples analyzed in this study were derived. The study sponsor participated in the study design, analysis and interpretation of the data, and in the preparation of the manuscript.
Statement of Financial Support: This project was funded by a research grant from Gilead Sciences to the Medical University of South Carolina.
Abbreviations, in order of appearance:
- HBV
hepatitis B virus
- HCC
hepatocellular carcinoma
- TDF
tenofovir disoproxil fumarate
- ADV
adefovir
- BMI
body-mass index
- miRNA
microRNA
- ALT
alanine transaminase
- sCD163
soluble cD163
- FDR
false discovery rate
- AUC
area under the receiver-operator curve
- NASH
non-alcoholic steatohepatitis
Footnotes
Conflict of Interest Declaration: RM, BL, ZJ, JF, and AG are employees of Gilead Sciences, manufacturers of TDF.
References
- 1.MAINI MK, BERTOLETTI A. HBV in 2016: Global and immunotherapeutic insights into hepatitis B. Nat Rev Gastroenterol Hepatol 2017; 14(2): 71–72. [DOI] [PubMed] [Google Scholar]
- 2.SCHWEITZER A, HORN J, MIKOLAJCZYK RT, KRAUSE G, OTT JJ. Estimations of worldwide prevalence of chronic hepatitis B virus infection: a systematic review of data published between 1965 and 2013. The Lancet 2015; 386(10003): 1546–55. [DOI] [PubMed] [Google Scholar]
- 3.ROBERTS H, KRUSZON-MORAN D, LY KN, et al. Prevalence of chronic hepatitis B virus (HBV) infection in U.S. households: National Health and Nutrition Examination Survey (NHANES), 1988-2012. Hepatology 2016; 63(2): 388–97. [DOI] [PubMed] [Google Scholar]
- 4.POLARIS OBSERVATORY C. Global prevalence, treatment, and prevention of hepatitis B virus infection in 2016: a modelling study. Lancet Gastroenterol Hepatol 2018; 3(6): 383–403. [DOI] [PubMed] [Google Scholar]
- 5.MARCELLIN P, GANE E, BUTI M, et al. Regression of cirrhosis during treatment with tenofovir disoproxil fumarate for chronic hepatitis B: a 5-year open-label follow-up study. Lancet 2013; 381(9865): 468–75. [DOI] [PubMed] [Google Scholar]
- 6.CHANG TT, LIAW YF, WU SS, et al. Long-term entecavir therapy results in the reversal of fibrosis/cirrhosis and continued histological improvement in patients with chronic hepatitis B. Hepatology 2010; 52(3): 886–93. [DOI] [PubMed] [Google Scholar]
- 7.JACOBSON IM, WASHINGTON MK, BUTI M, et al. Factors Associated With Persistent Increase in Level of Alanine Aminotransferase in Patients With Chronic Hepatitis B Receiving Oral Antiviral Therapy. Clin Gastroenterol Hepatol 2017; 15(7): 1087–94 e2. [DOI] [PubMed] [Google Scholar]
- 8.PANT K, VENUGOPAL SK. Circulating microRNAs: Possible role as non-invasive diagnostic biomarkers in liver disease. Clin Res Hepatol Gastroenterol 2017; 41(4): 370–77. [DOI] [PubMed] [Google Scholar]
- 9.SINGH AK, ROOGE SB, VARSHNEY A, et al. Global microRNA expression profiling in the liver biopsies of hepatitis B virus-infected patients suggests specific microRNA signatures for viral persistence and hepatocellular injury. Hepatology 2018; 67(5): 1695–709. [DOI] [PubMed] [Google Scholar]
- 10.BAO S, ZHENG J, LI N, et al. Serum MicroRNA Levels as a Noninvasive Diagnostic Biomarker for the Early Diagnosis of Hepatitis B Virus-Related Liver Fibrosis. Gut Liver 2017; 11(6): 860–69. [DOI] [PMC free article] [PubMed] [Google Scholar]
- 11.PAPATHEODORIDIS G, TRIANTOS C, HADZIYANNIS E, et al. Serum HBsAg kinetics and usefulness of interferon-inducible protein 10 serum in HBeAg-negative chronic hepatitis B patients treated with tenofovir disoproxil fumarate. J Viral Hepat 2015; 22(12): 1079–87. [DOI] [PubMed] [Google Scholar]
- 12.DULTZ G, GERBER L, FARNIK H, et al. Soluble CD163 is an indicator of liver inflammation and fibrosis in patients chronically infected with the hepatitis B virus. J Viral Hepat 2015; 22(4): 427–32. [DOI] [PubMed] [Google Scholar]
- 13.SCHWARZENBACH H, DA SILVA AM, CALIN G, PANTEL K. Data Normalization Strategies for MicroRNA Quantification. Clin Chem 2015; 61(11): 1333–42. [DOI] [PMC free article] [PubMed] [Google Scholar]
- 14.LI Y, ZHANG L, LIU F, XIANG G, JIANG D, PU X. Identification of endogenous controls for analyzing serum exosomal miRNA in patients with hepatitis B or hepatocellular carcinoma. Dis Markers 2015; 2015: 893594. [DOI] [PMC free article] [PubMed] [Google Scholar]
- 15.VAN DER REE MH, JANSEN L, KRUIZE Z, et al. Plasma MicroRNA Levels Are Associated With Hepatitis B e Antigen Status and Treatment Response in Chronic Hepatitis B Patients. J Infect Dis 2017; 215(9): 1421–29. [DOI] [PubMed] [Google Scholar]
- 16.TRAN M, LEE SM, SHIN DJ, WANG L. Loss of miR-141/200c ameliorates hepatic steatosis and inflammation by reprogramming multiple signaling pathways in NASH. JCI Insight 2017; 2(21). [DOI] [PMC free article] [PubMed] [Google Scholar]
- 17.YANG Y, LIU Y, XUE J, et al. MicroRNA-141 Targets Sirt1 and Inhibits Autophagy to Reduce HBV Replication. Cell Physiol Biochem 2017; 41(1): 310–22. [DOI] [PubMed] [Google Scholar]
- 18.MATSUURA K, DE GIORGI V, SCHECHTERLY C, et al. Circulating let-7 levels in plasma and extracellular vesicles correlate with hepatic fibrosis progression in chronic hepatitis C. Hepatology 2016; 64(3): 732–45. [DOI] [PMC free article] [PubMed] [Google Scholar]
- 19.SINGARAVELU R, RUSSELL RS, TYRRELL DL, PEZACKI JP. Hepatitis C virus and microRNAs: miRed in a host of possibilities. Current opinion in virology 2014; 7C: 1–10. [DOI] [PubMed] [Google Scholar]
- 20.CHENG Y, MAI J, HOU T, PING J. MicroRNA-421 induces hepatic mitochondrial dysfunction in non-alcoholic fatty liver disease mice by inhibiting sirtuin 3. Biochem Biophys Res Commun 2016; 474(1): 57–63. [DOI] [PubMed] [Google Scholar]
- 21.SEKI E, SCHWABE RF. Hepatic Inflammation and Fibrosis: Functional Links and Key Pathways. Hepatology 2014. [DOI] [PMC free article] [PubMed] [Google Scholar]
- 22.TANAKA M, MIYAJIMA A. Liver regeneration and fibrosis after inflammation. Inflammation and Regeneration 2016; 36(1). [DOI] [PMC free article] [PubMed] [Google Scholar]
- 23.ROCKEY DC. Translating an understanding of the pathogenesis of hepatic fibrosis to novel therapies. Clin Gastroenterol Hepatol 2013; 11(3): 224–31 e1-5. [DOI] [PMC free article] [PubMed] [Google Scholar]
- 24.LAI S, IWAKIRI Y. Is miR-21 a potent target for liver fibrosis? Hepatology 2018. [DOI] [PMC free article] [PubMed] [Google Scholar]
- 25.CAVIGLIA JM, YAN J, JANG MK, et al. MicroRNA-21 and Dicer are dispensable for hepatic stellate cell activation and the development of liver fibrosis. Hepatology 2018; 67(6): 2414–29. [DOI] [PMC free article] [PubMed] [Google Scholar]
- 26.LAI S, IWAKIRI Y. Is miR-21 a potent target for liver fibrosis? Hepatology 2018; 67(6): 2082–84. [DOI] [PMC free article] [PubMed] [Google Scholar]
- 27.LEIDINGER P, BACKES C, MEDER B, MEESE E, KELLER A. The human miRNA repertoire of different blood compounds. BMC Genomics 2014; 15: 474. [DOI] [PMC free article] [PubMed] [Google Scholar]
- 28.VAN DER REE MH, DE VREE JM, STELMA F, et al. Safety, tolerability, and antiviral effect of RG-101 in patients with chronic hepatitis C: a phase 1B, double-blind, randomised controlled trial. The Lancet 2017; 389(10070): 709–17. [DOI] [PubMed] [Google Scholar]
Associated Data
This section collects any data citations, data availability statements, or supplementary materials included in this article.


