. 2020 Nov 19;2(6):e200406. doi: 10.1148/ryct.2020200406

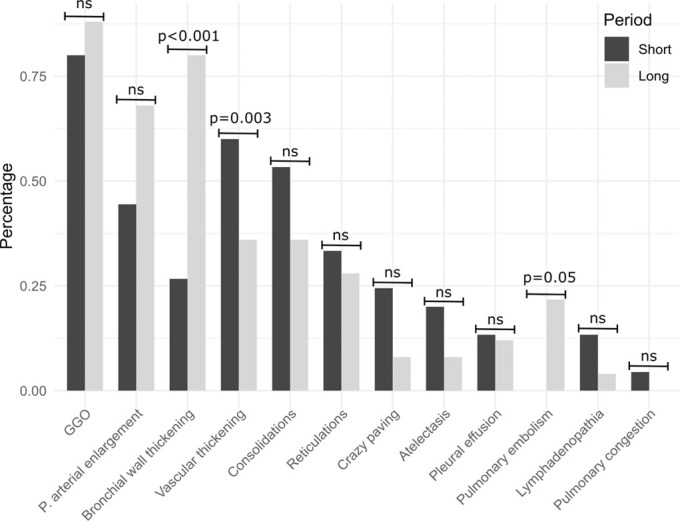
Figure 2b:

(a) Frequencies of lobewise analysis of radiologic findings according to severity grading (in gray) and binary categories (present/absent) for the pulmonary arterial enlargement and vascular thickening sign (in blue). (b) Percentage of radiologic findings according to the time interval between onset of symptoms and CT. P values are provided if significant. Percentage defined as ratio of lobes with a given feature in relation to all lobes within the time interval category. GGO = ground-glass opacities, P = pulmonary, ns = not significant.

(a) Frequencies of lobewise analysis of radiologic findings according to severity grading (in gray) and binary categories (present/absent) for the pulmonary arterial enlargement and vascular thickening sign (in blue). (b) Percentage of radiologic findings according to the time interval between onset of symptoms and CT. P values are provided if significant. Percentage defined as ratio of lobes with a given feature in relation to all lobes within the time interval category. GGO = ground-glass opacities, P = pulmonary, ns = not significant.