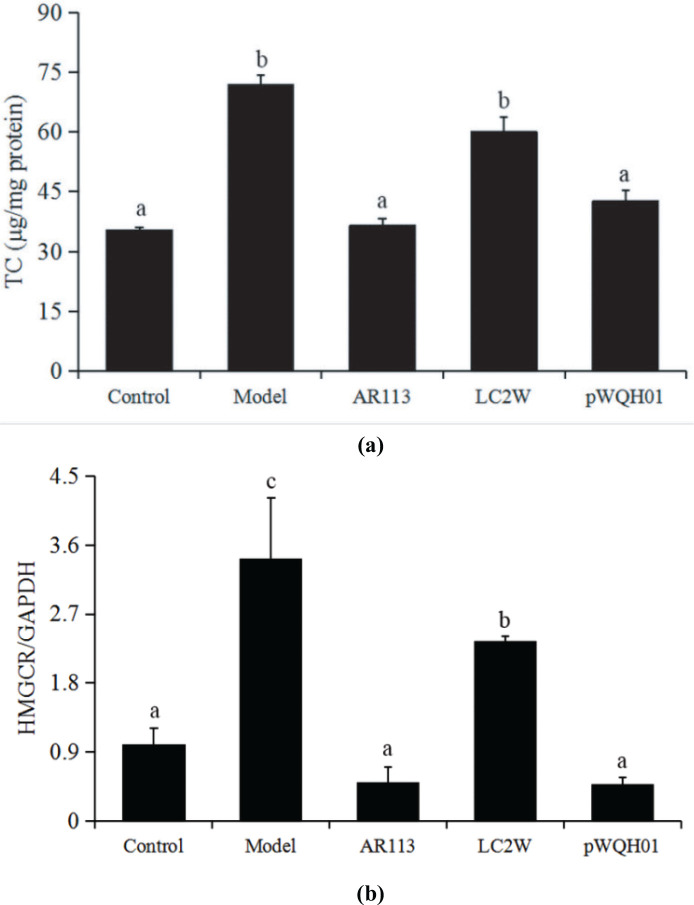
Fig. 3.
The effects of probiotic strains on total cholesterol (TC) levels. (a) TC levels in HepG2 cells. (b) HMGCR mRNA levels. Data represent the means ± standard deviations (n = 3). Statistical differences between groups were determined by a one-way ANOVA. Different letters indicate statistically significant differences between groups, P < 0.05.

