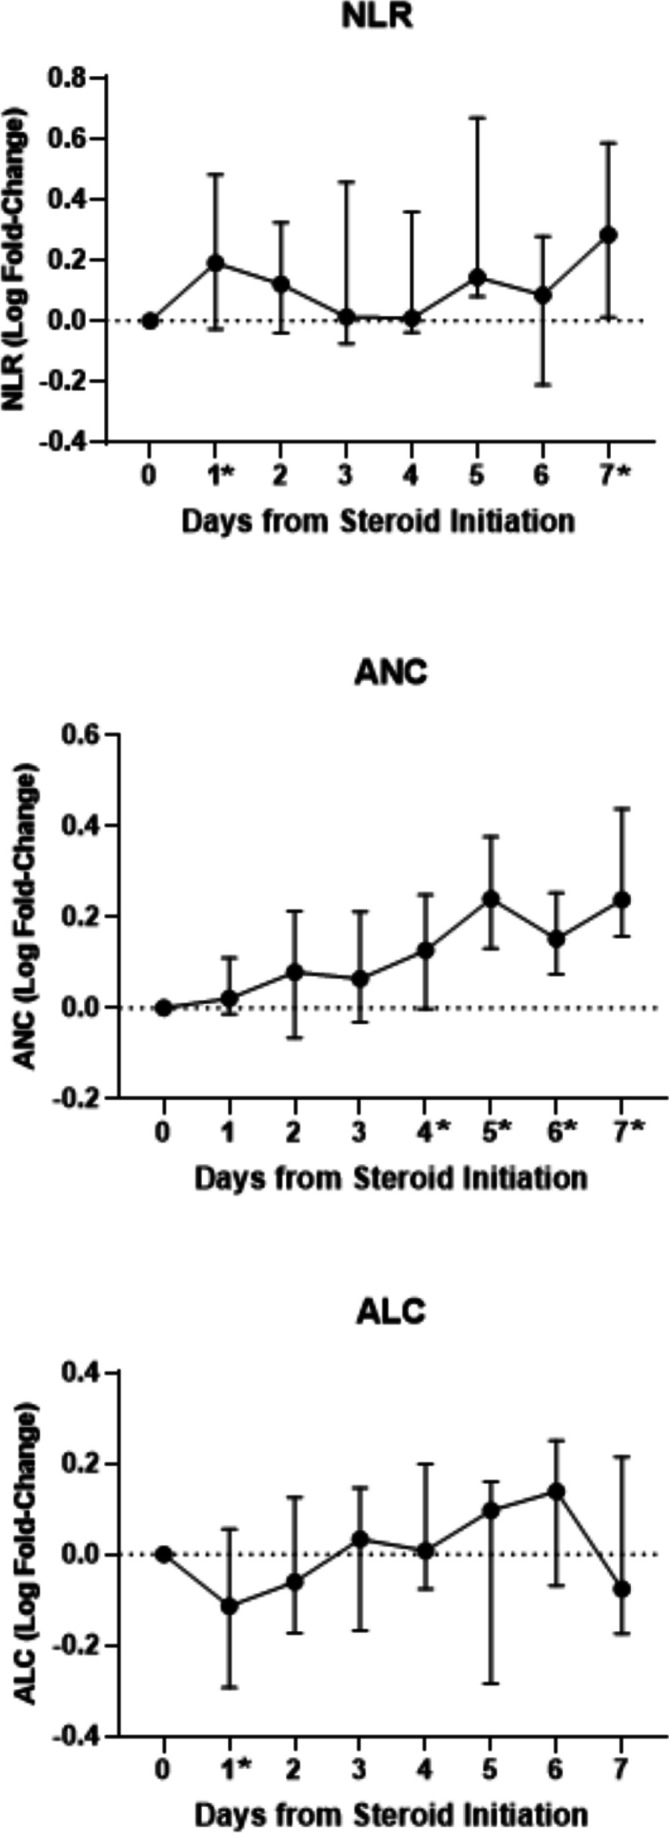
Figure 2.

Median log fold change from presteroids to each post day 1–7 for NLR, ANC, and ALC is shown, along with the IQR. The medians and IQRs in this figure reflect all available values at each timepoint, as opposed to the paired pre and post values shown in table 2. Timepoints with significant changes from the paired analysis in table 2 are indicated here with an asterisk (*). ALC, absolute lymphocyte count; ANC, absolute neutrophil count; IQR, interquartile range; NLR, neutrophil-to-lymphocyte ratio.
