
Fig. 3. Combination GSH and CoA inhibition induces ferroptosis in human PDAC cells.
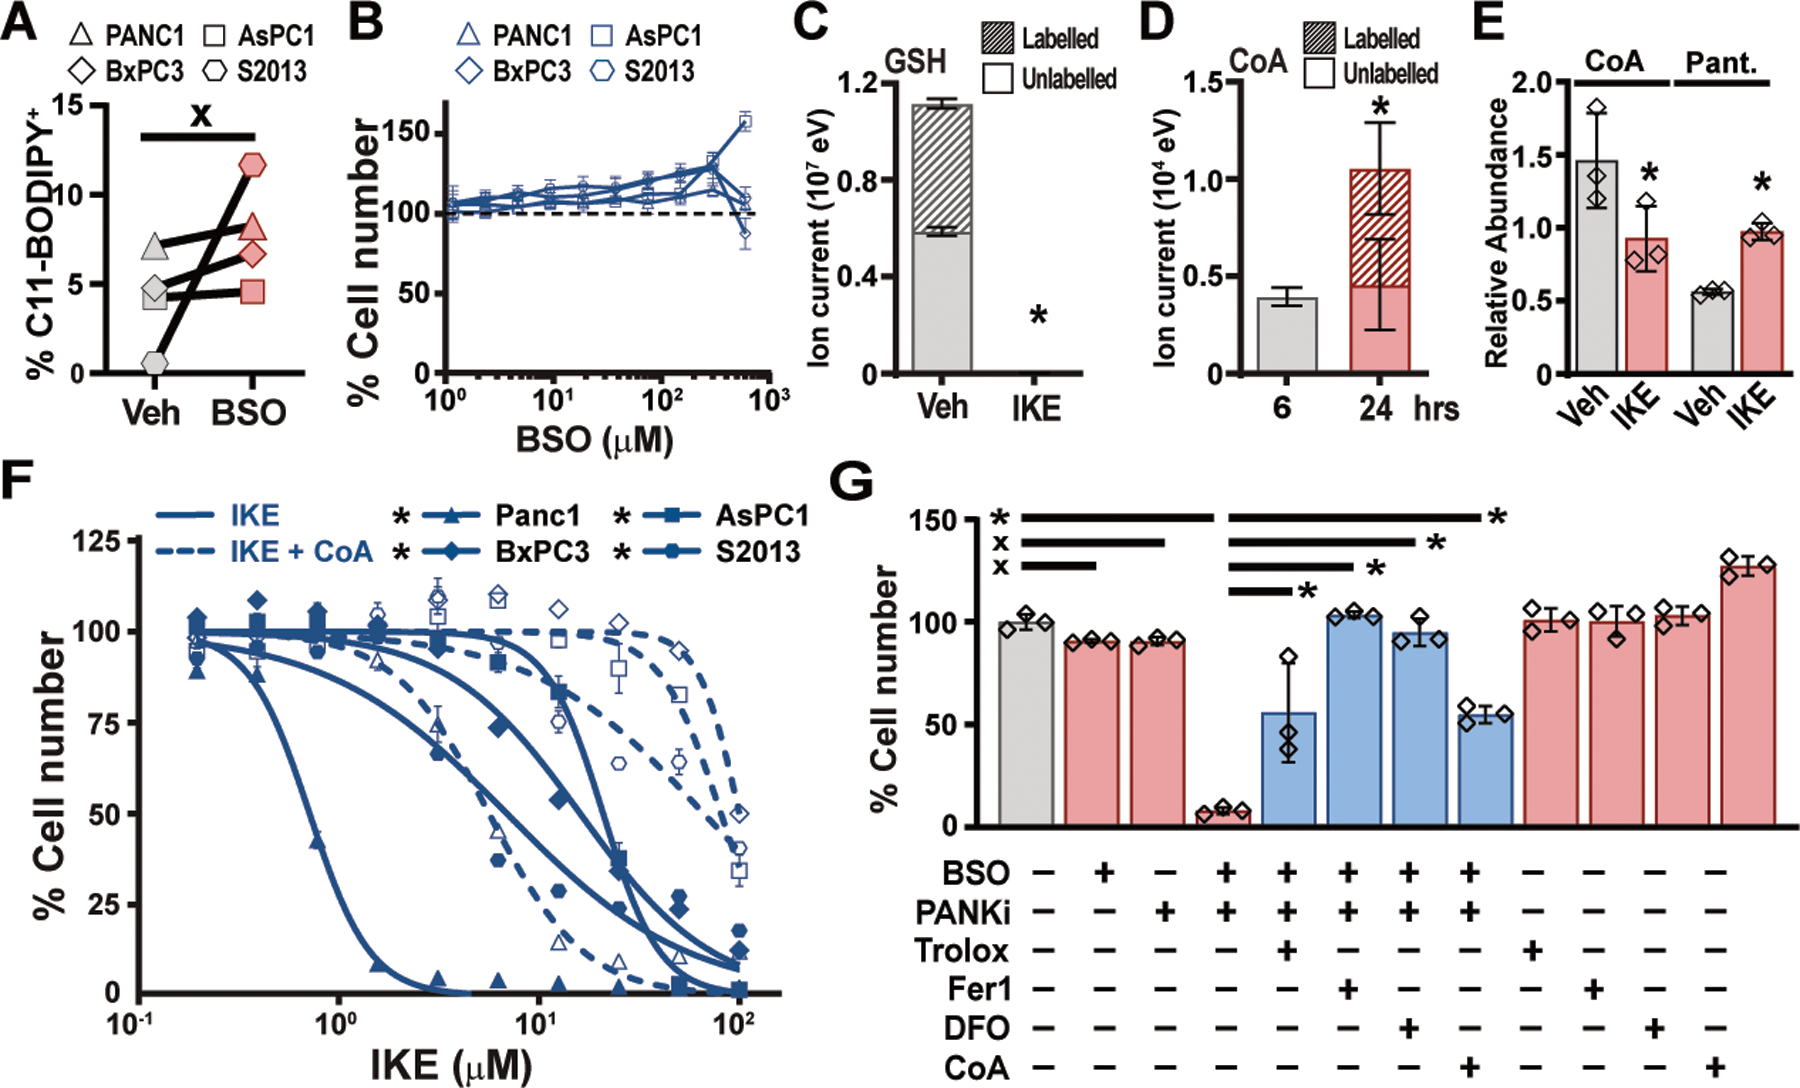
(A) Flow cytometry for C11-BODIPY fluorescence in four human PDAC lines treated for 6 hours with 150 μM BSO. Paired t-test. (B) Viability of human PDAC cells treated for 24 hours with indicated concentrations of BSO. (C) Liquid chromatography time-of-flight mass spectrometry (LC-TOF-MS) analysis of GSH in PANC-1 cells labelled for 6 hours with 13C-cystine combined with vehicle or 5μM IKE. Student’s t-test. (D) LC-TOF-MS analysis of CoA in PANC-1 cells labelled for 6 hours with 13C-cystine, after 6 or 24 hours. Student’s t-test. (E) Liquid chromatography triple quadrupole tandem mass spectrometry (LC-QqQ-MS) measurements of CoA and pantothenate (Pant.) levels in Panc-1 cells treated with vehicle and IKE for six hours. Student’s t-test. (F) Viability of human PDAC cell lines treated with IKE, alone or in combination 200 μM CoA. Student’s t-test comparing maximal cytotoxicity ± CoA. (G) PANC-1 cells treated for 24 hours with combinations of 300 μM BSO and 5 μM PANKi along with Trolox, Fer-1, DFO, or CoA as described in Fig. 1C. Tukey test. In all panels, * p < 0.05, x = not significantly different. In panels A, B, E, and F, data are means ±SEM from three independent experiments. In panels C and D, data are means ± SD from three biological replicates. In (E), * p < 0.05 comparing maximal cytotoxicity in CoA treated vs. untreated conditions for each line, Student’s t-test. In (F), * p < 0.05, one-way ANOVA with posthoc Tukey test.