
Figure 5.
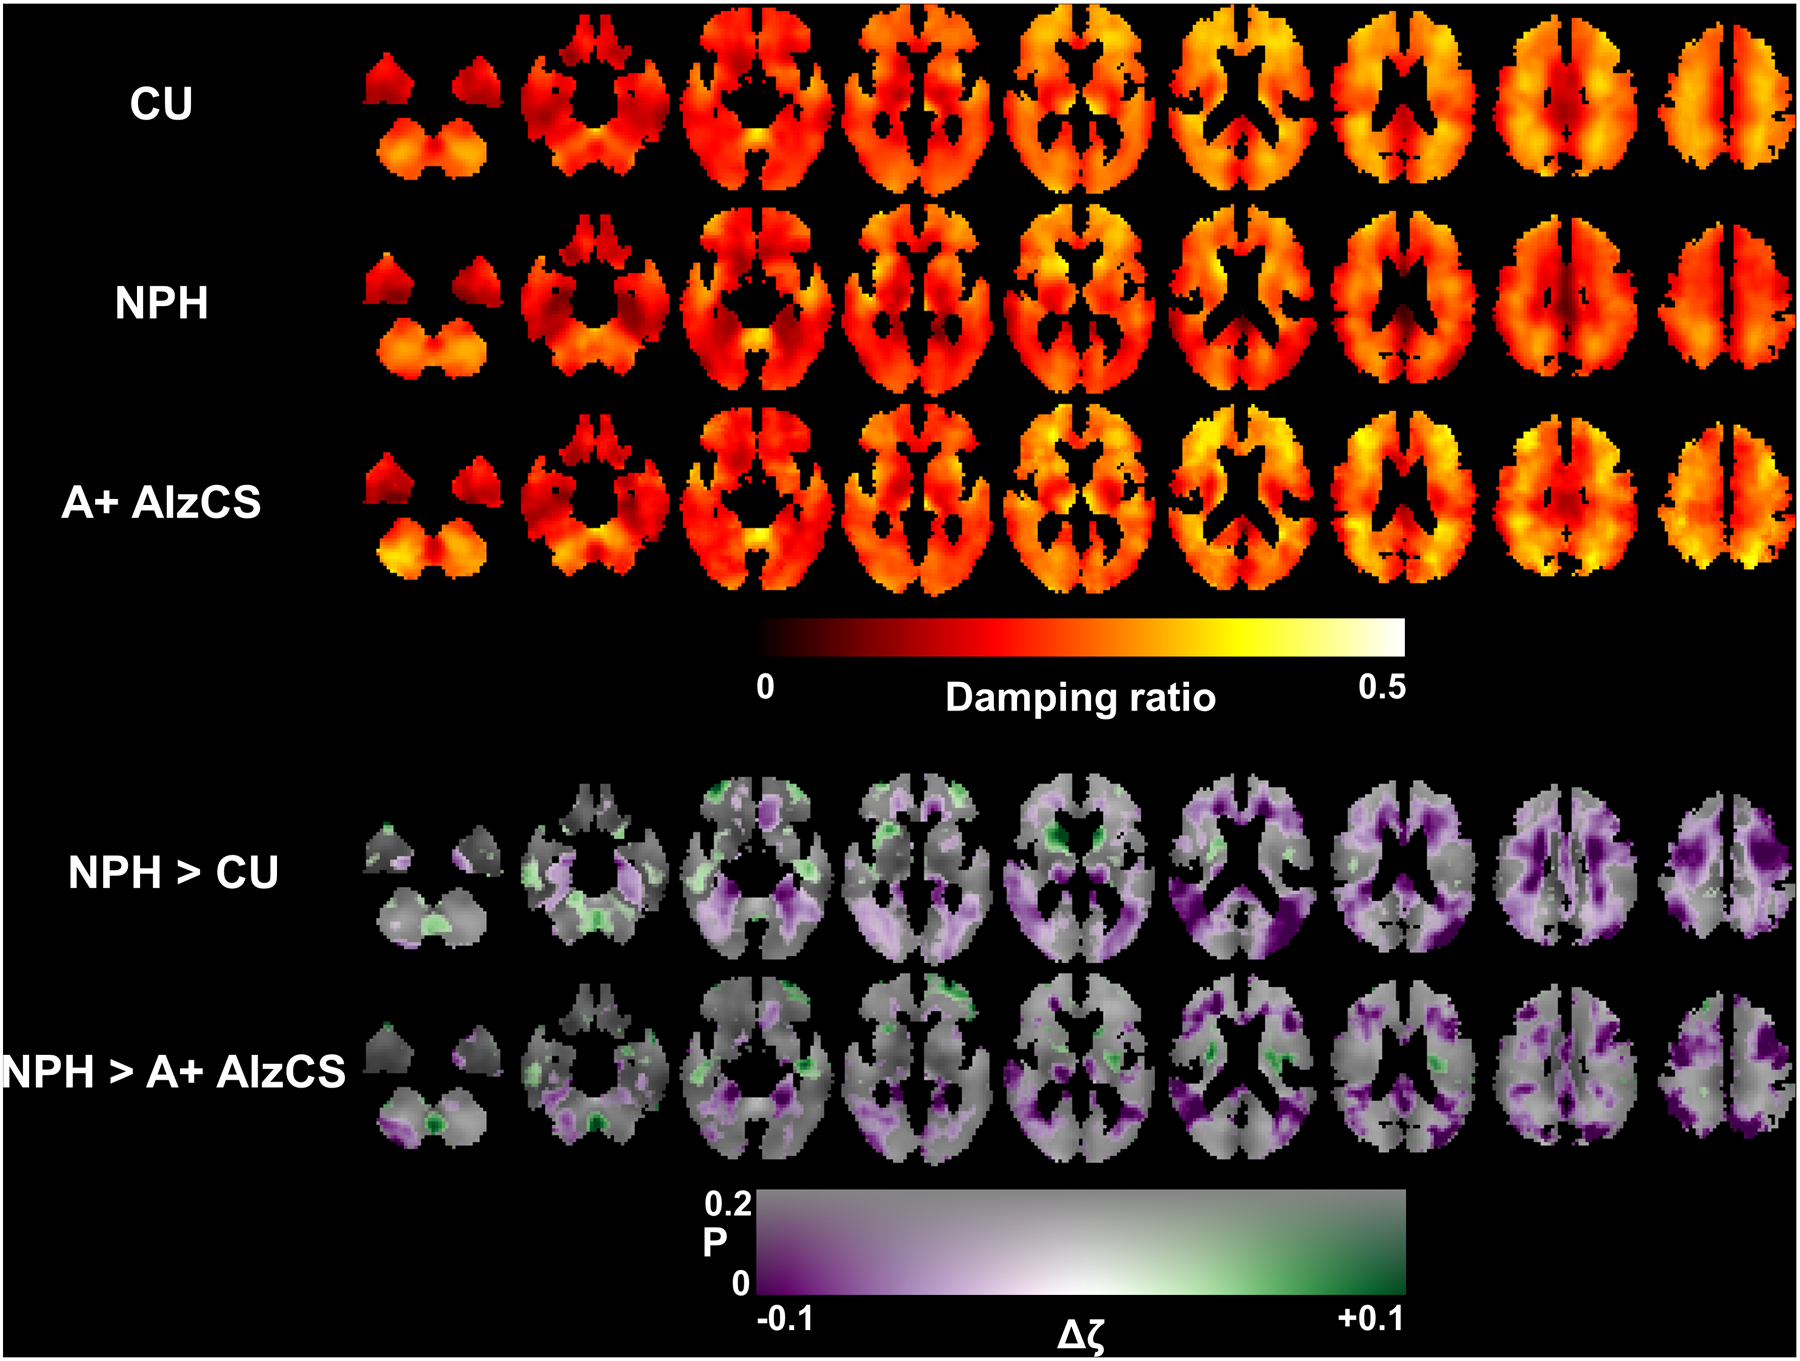
Top panel: Mean damping ratio maps for each of the 3 groups after correction for age and sex. Each column shows a different slice location, arranged from inferior to superior positions. Bottom panel: Maps of the estimated change in damping ratio (Δζ) due to NPH with respect to both the CU and A+ AlzCS groups. The difference map is overlaid on the mean CU stiffness map, with color representing the magnitude of the stiffness change and transparency encoding the uncorrected P-value estimated from a T-test on the relevant model coefficient.