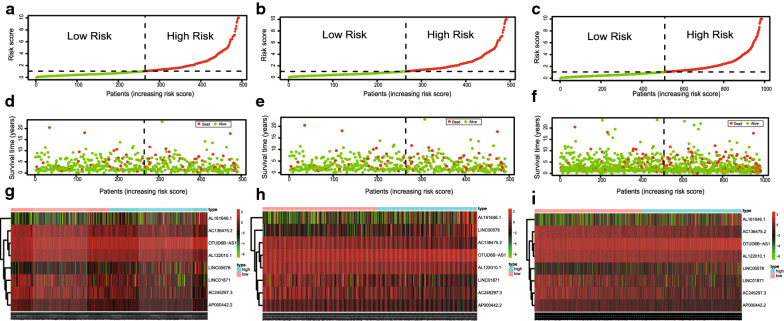
Fig. 3.
Immune-related lncRNA signature risk score analysis. The signature risk score distribution in the training (a), testing (b) and total set (c). The scatter plot of the sample survival overview in the training (d), testing (e) and total set (f), the green and red dots respectively represent survival and death. Heatmap showed the expression profiles distribution of the signature in the low-risk groups and high-risk groups in the training (g), testing (h) and total set (i), the pink bar represented the low-risk group, and the blue bar represents the high-risk group

