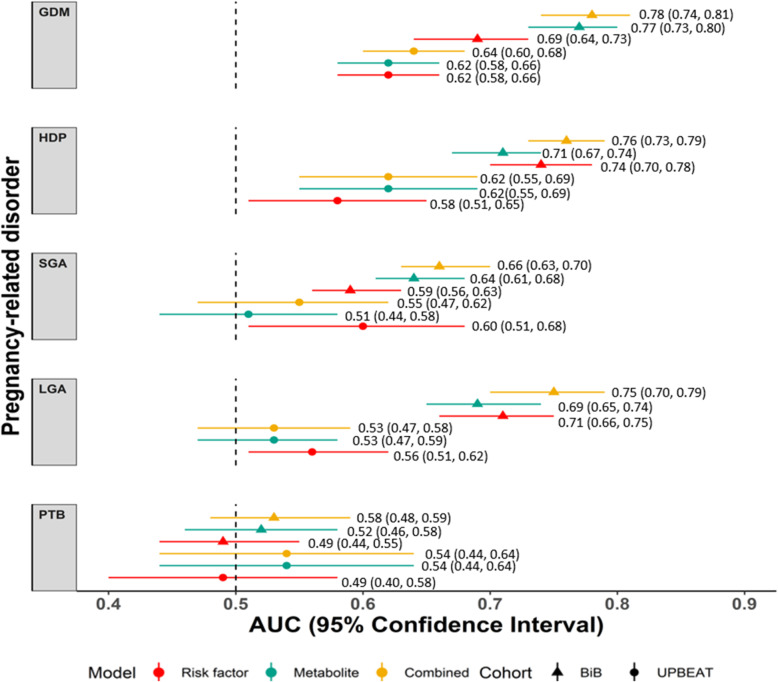
Fig. 2.
The area under the curve (AUC) for all three models with all outcomes in the Born in Bradford (triangles) and the UK Pregnancies Better Eating and Activity Trial (circles). Predictive discrimination of models for each outcome: AUC and 95% confidence intervals are shown for established risk factor prediction models (red), metabolite models (green) and combined risk factor and metabolite models (yellow) in BiB (triangles) and UPBEAT (circles). GDM, gestational diabetes; HDP, hypertensive disorders of pregnancy; SGA, small for gestational age; LGA, large for gestational age; PTB, preterm birth (iatrogenic or spontaneous) (Additional file 1: Table S6)

