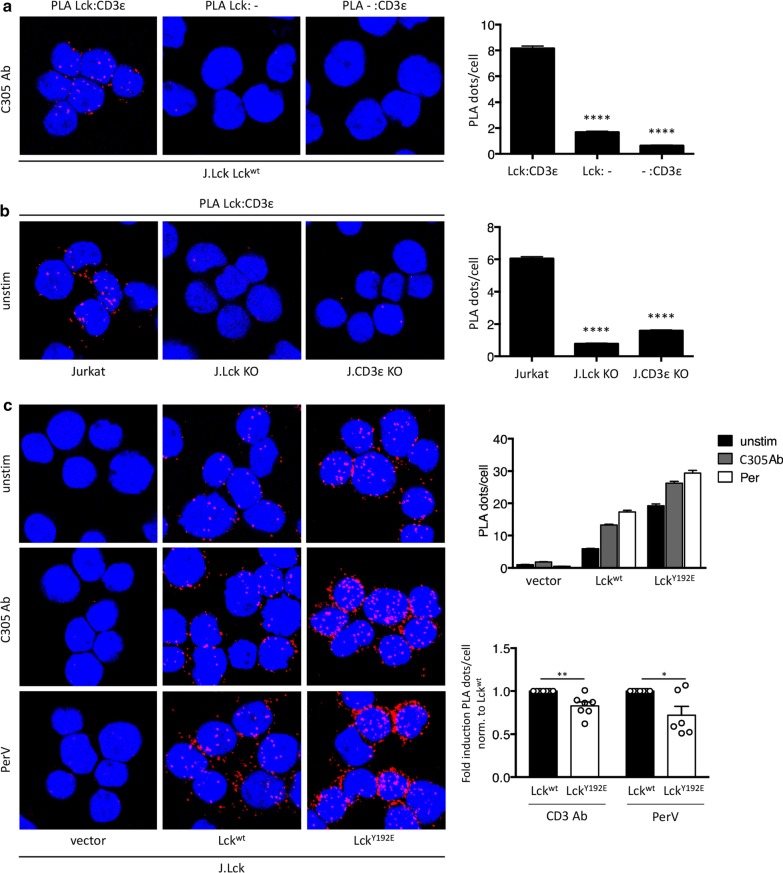
Fig. 7.
Y192 influences ligand-induced closed proximity between Lck and the TCR. a Technical PLA controls in J.Lck cells reconstituted with Lckwt stimulated with a CD3 antibody at 37 °C for 5 min. PLA was performed with both primary antibodies (left), with only the anti-Lck primary antibody (middle) or with only the anti-CD3ε primary antibody (right). In all cases, both secondary antibodies were used. The quantification of two independent experiments was analyzed using One-way ANOVA test (bar diagram). Mean values ± SEM are shown. ****p < 0.0001. b Biological PLA controls in Jurkat cells expressing surface TCR and Lck (left), Jurkat cells lacking Lck expression by CRISPR/Cas9 gene editing (J.Lck, middle) and Jurkat cells lacking CD3ε by CRISPR/Cas9 gene editing (J.CD3εKO, right). The PLA was performed between the TCR (CD3ε) and Lck at 37 °C in unstimulated conditions. The quantification of two independent experiments is shown (bar diagram). Statistical analysis was performed as in a. c In situ PLA between the TCR (CD3ε) and Lck was performed; a red fluorescent signal indicates a distance between Lck and the TCR smaller than 80 nm. J.Lck cells were transfected to stably express an empty vector, Lckwt or LckY192E. Cells were either left unstimulated, stimulated with a TCR antibody (C305) or stimulated with pervanadate at 37 °C for 5 min. Nuclei were stained with DAPI. Data of one representative experiment performed in technical duplicates is shown (upper bar diagram). In order to pool independently performed experiments and to normalize for Lck expression, the fold induction between unstimulated and stimulated samples per experiment was calculated (lower bar diagram). An unpaired Student’s t test on pooled data of 6–7 independent experiments was analysed. Mean values ± SEM are shown, *p < 0.1; **p < 0.01

