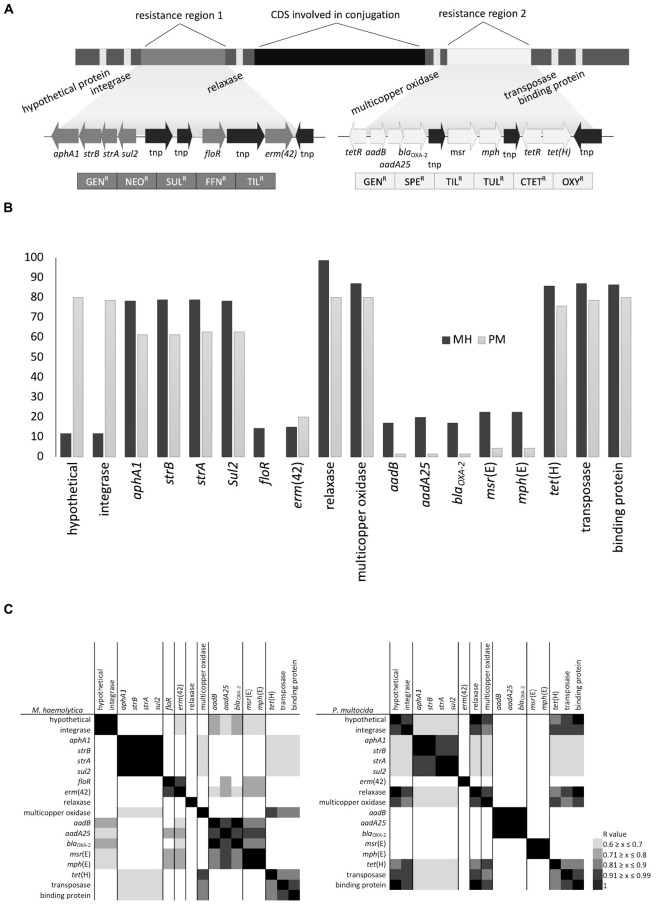
FIGURE 4.
(A) Schematic representation of gene arrangement in ICEPmu1 originating from Pasteurella multocida, (B) percentage of isolates positive for antimicrobial resistance genes (ARGs) and ICE-associated genes, and (C) heatmaps displaying the association between ARGs and ICE-associated genes based on Pearson’s correlation coefficient.

