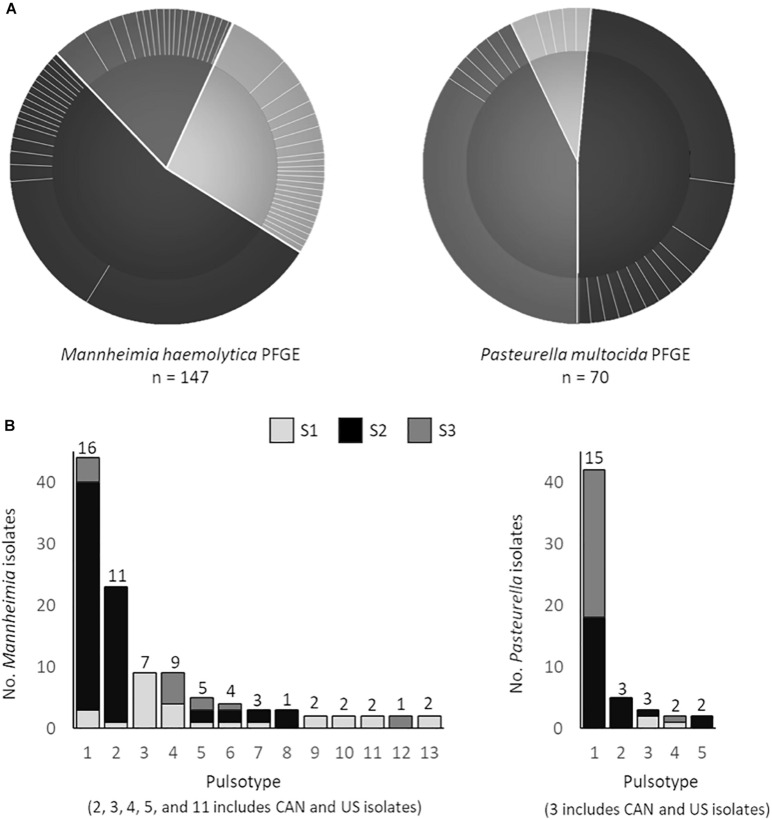
FIGURE 6.
(A) Pulsed-field gel electrophoresis (PFGE) profiles of Mannheimia haemolytica (SalI) and Pasteurella multocida (ApaI) isolates. Pie charts depict the number of unique pulsotypes (>95% similarity) per study (study 1 M. haemolytica = 40, P. multocida = 6; study 2 M. haemolytica = 80, P. multocida = 34; study 3 M. haemolytica = 27, P. multocida = 34) and the proportion of isolates with each pulsotype. (B) PFGE profiles that contain strains from multiple locations. Numbers above each bar represent the number of unique antimicrobial susceptibility profiles within each unique PFGE profile.

