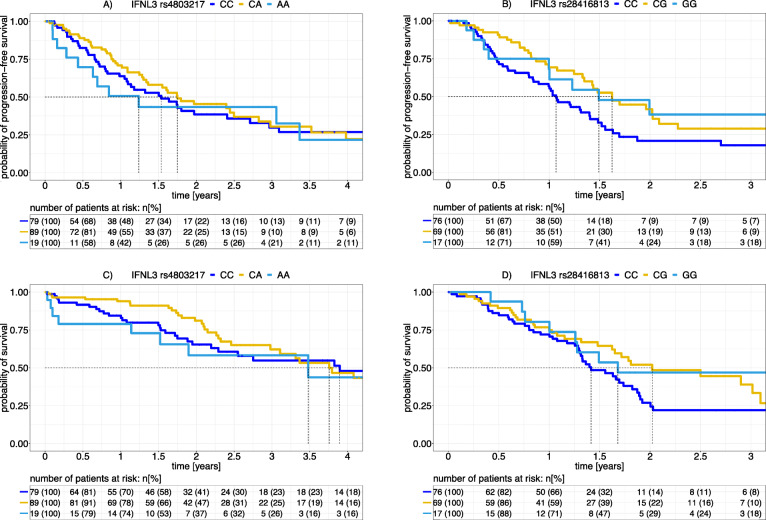
Fig. 2.
Time-to-event analyses for the length of the specific PFI and for OS time according to Kaplan-Meier for HCC and PDAC patients. HCC and PDAC patients were stratified for IFNL3 rs4803217 and IFNL3 rs28416813 genotypes, respectively. The probability of the absence of an event, which is progression (upper panels) or death (lower panels), is given in Kaplan-Meier graphs for each genotype for a period of 4 yrs. for HCC or 3 yrs. for PDAC as indicated. Dotted lines indicate the median specific PFIs and the median OS times. Tables list absolute and relative numbers of patients at risk (living and non-censored). A logrank test yielded a significant relationship between IFNL genotypes and disease outcome for PDAC patients (p(PFI) = 0.01, and p(OS) = 0.05, IFNL3 rs28416813 CC vs CG/GG) but not for HCC patients (p(PFI) = 0.65 and p(OS) = 0.87, IFNL3 rs4803217 CC vs CA/AA). This test was performed by comparing carriers of SNP variants that correspond to their ability to express IFNL4 (light blue and yellow) to knockout variant homozygotes (dark blue)

