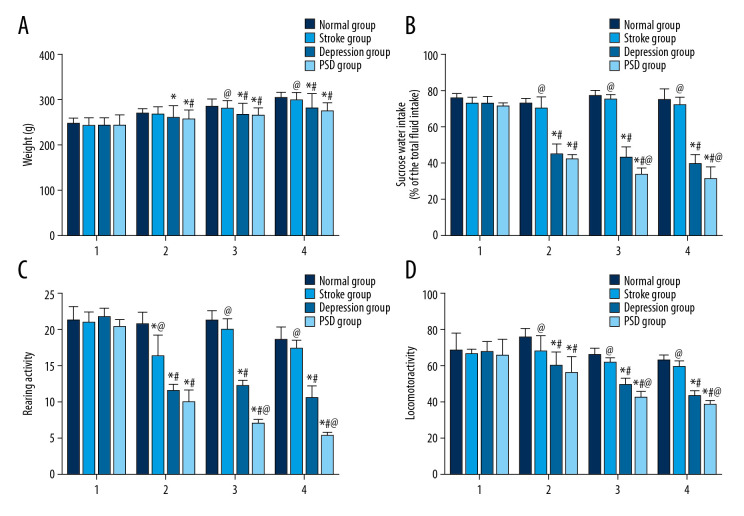
Figure 1.
Behavioral testing results in each group at different time points after CUMS. Histograms show (A) body weight (indicative of feeding behavior), (B) sucrose preference, (C) rearing activity, and (D) locomotor activity. Data are presented as mean±SE. Intergroup comparisons evaluated by 1-way ANOVA. N=10 rats/group; 1 (first day after CUMS), 2 (2 weeks), 3 (4 weeks), 4 (8 weeks). * P<0.05 versus normal control rats; @ P<0.05 versus depression model rats (isolation-housing combined with CUMS); # P<0.05 versus stroke model rats (MCAO only). ANOVA – analysis of variance; CUMS – chronic unpredictable mild stress; MCAO – middle cerebral artery occlusion.

