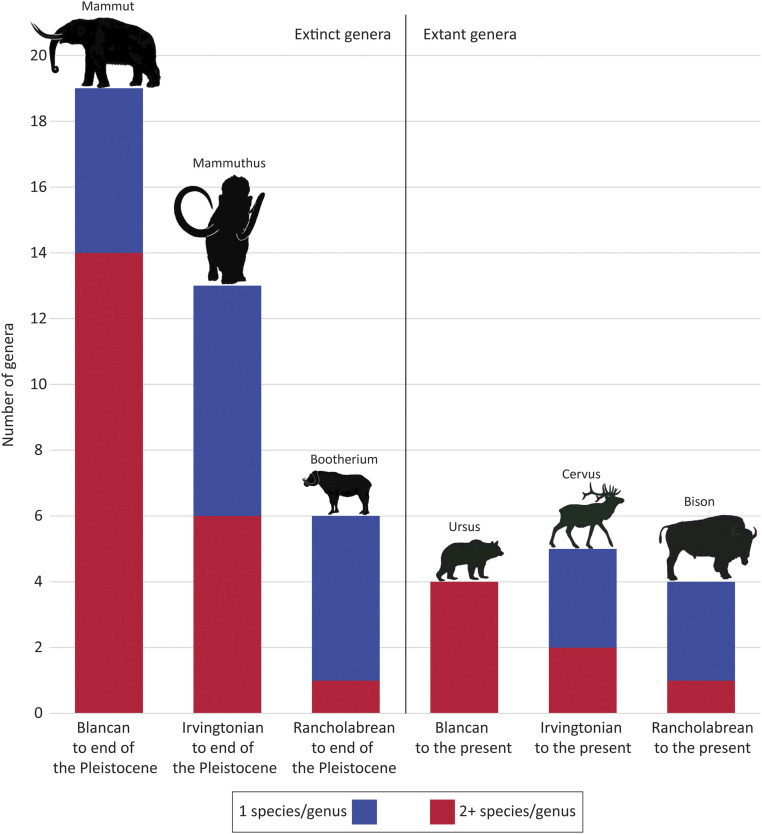
Fig. 1.
Histogram of frequency of extinct and extant genera by NALMA range and number of genera per species. Each column shows the total number of genera for the NALMA range denoted: the blue segments are the number of genera with only 1 species per genus; the red segments are the number of genera with 2+ species per genus. (Left) Extinct genera (data from Table 3). (Right) Extant genera (data from Table 5). Note the decline of multispecies genera (red segments) over shorter time spans for both extinct and extant taxa. The illustrated taxa are examples of genera in each NALMA column. Silhouettes courtesy of Anthony J. Stuart, reproduced with permission from ref. 7.

