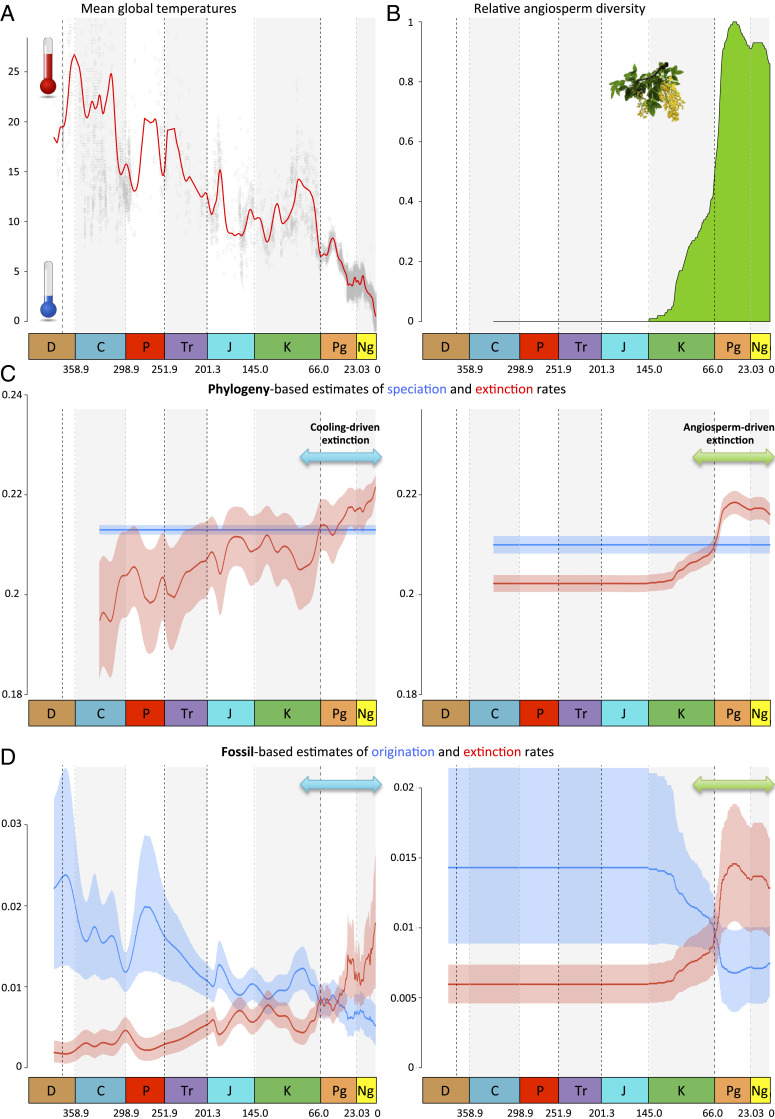
Fig. 3.
Drivers of conifer diversification dynamics according to two putative causes of rate variation: global temperature changes (A) and angiosperm diversity (B). Based on oxygen isotopes (69), the mean global temperature curve is a proxy for the main climatic events in the last 350 My. The changes of angiosperm diversity through time show the rise of angiosperms during the Cretaceous as inferred by fossil-based analyses of vascular plants (27). Solid lines indicate mean parameter estimates (C) and mean posterior estimates (D) of the rates, and the shaded areas show CIs and 95% credibility intervals, respectively. Taken together, the phylogeny-based (C) and fossil-based (D) correlations show that 1) changes in angiosperm diversity correlate positively with extinction rates of conifers and 2) the variation of temperatures correlates negatively with extinction rate of conifers. C, Carboniferous; D, Devonian; J, Jurassic; K, Cretaceous; Ng, Neogene; P, Permian; Pg, Paleogene; Tr, Triassic.

