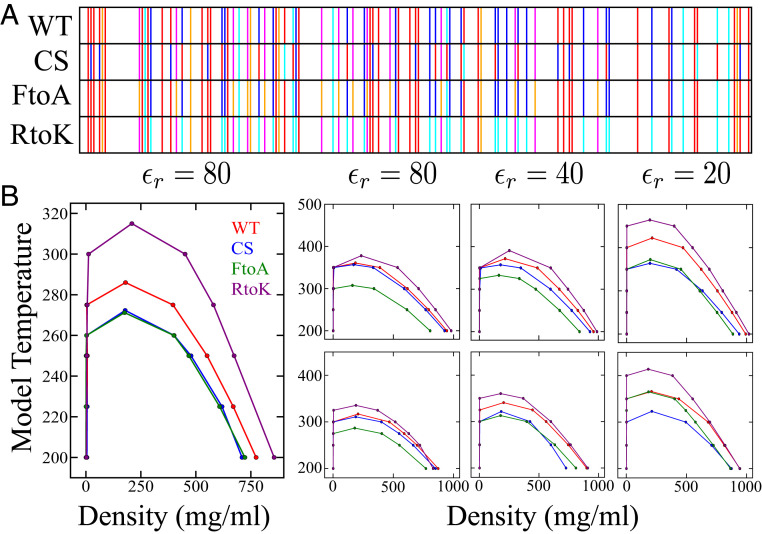
Fig. 3.
Simulated phase behaviors of Ddx4 IDR variants in a hydrophobicity-dominant potential augmented by cation– interactions. (A) Sequence patterns of the WT and its charge-scrambled (CS), Phe to Ala (FtoA) and Arg to Lys (RtoK) variants. Select residue types are highlighted: Ala (orange), Asp and Glu (red), Phe (magenta), Lys (cyan), and Arg (dark blue); other residue types are not distinguished. (B) Simulated phase diagrams of WT, CS, FtoA, and RtoK Ddx4 IDR at various relative permittivities () as indicated, using the HPS model only (Left) and the HPS model augmented with cation– interactions (Right) with either (Top) a uniform as described in Fig. 2A or (Bottom) different values for Arg and Lys as given in Fig. 2B.

