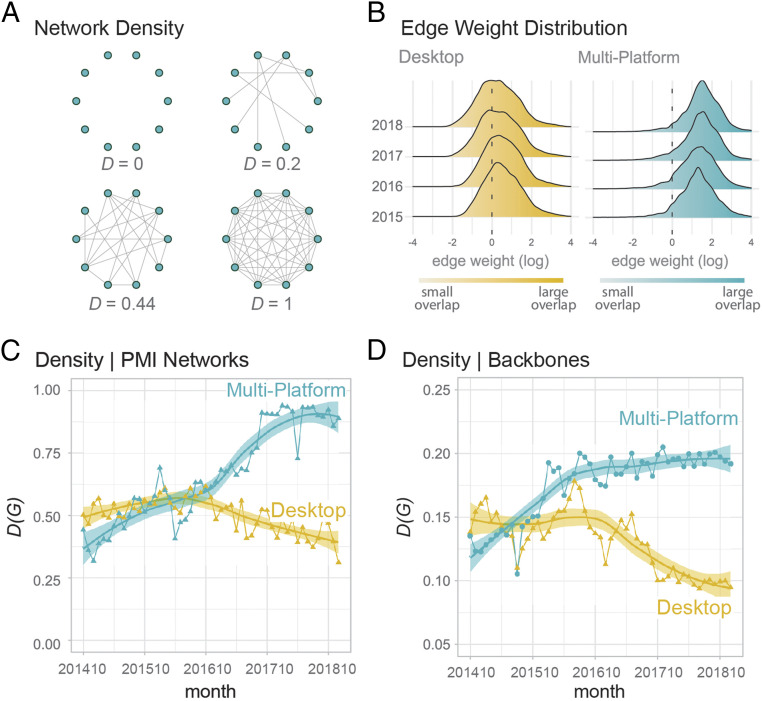
Fig. 2.
Networks of audience overlap across news sources. The nodes in these networks are news outlets and the ties measure the number of users coexposed to those outlets. (A) Network density measures the number of existing ties out of all possible ties that could exist in the network. In an empty network with no audience overlap the density is 0; in a complete network (where all outlets share some audience) the density is 1. (B) Edge weight distribution for desktop and multiplatform data (expressed in thousands). Density scores are based on the presence of ties, but coexposure ties are very heterogeneous in terms of audience overlap. To eliminate the weakest ties, we apply two filtering techniques to our data: PMI and backbone extraction. (C and D) Networks of audience overlap grow denser over time, regardless of the filtering technique used: The pattern remains visible even when only the most significant ties are preserved (see SI Appendix for trends in the raw, unfiltered data). This trend suggests that exposure to news is becoming more diversified and less fragmented. Data that use desktop-only estimates lead to the opposite conclusion.

