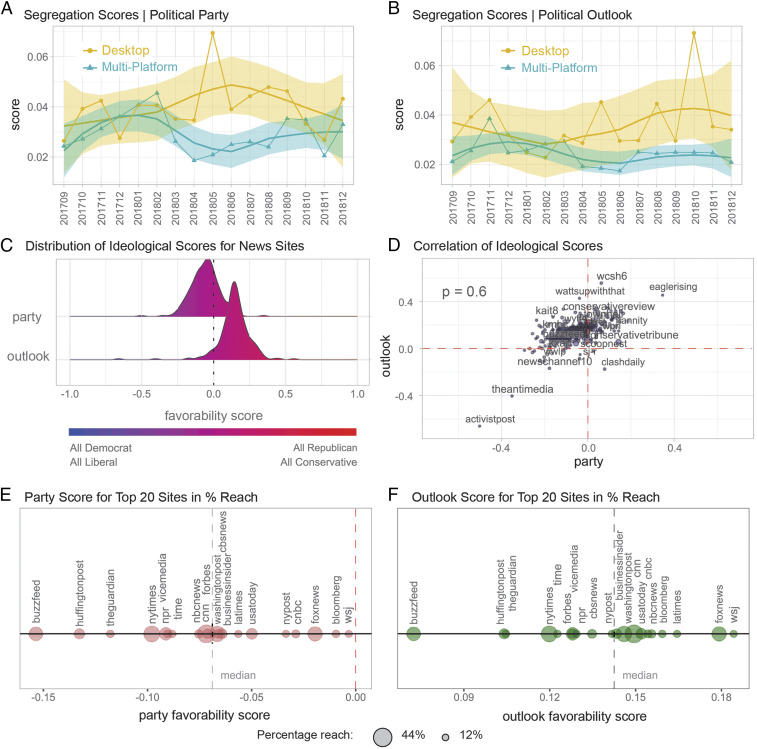
Fig. 3.
Ideological scores assigned to news outlets using their audience composition. (A and B) Changes in the segregation scores (Materials and Methods) for desktop and multiplatform data. Consistently, the local average means (smooth line) for multiplatform data are lower or equal to the desktop data, suggesting lower segregation levels when mobile access is considered. (C) Distribution of favorability scores for party affiliation and political outlook (Materials and Methods). The audiences consuming news in our data tend to lean Democrat and toward conservative views. (D) Scatterplot showing a moderate association of party affiliation and political outlook. (E and F) Alignment of top 20 outlets in the favorability scales. The news sites with higher percentage reach (and, therefore, a larger audience base) converge toward the median of the favorability scores.

