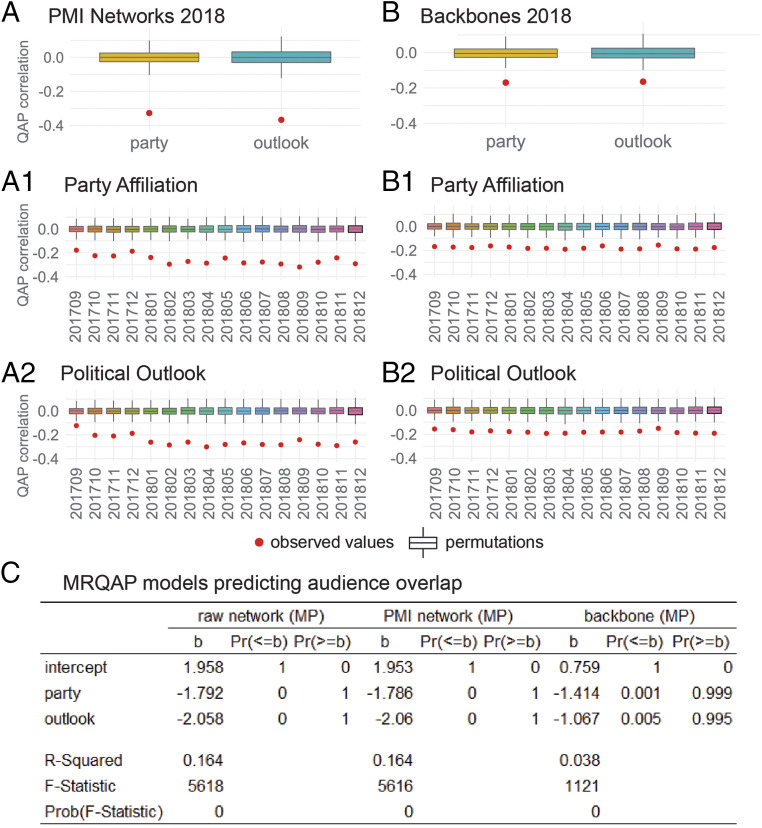
Fig. 4.
Correlation of audience overlap and ideological scores. The correlation of the coexposure network and pairwise distance in the ideological distributions is negative and highly significant in both the PMI networks (A) and backbones (B). Boxplots provide nonparametric confidence intervals based on random permutations. The correlation is negative because audience overlap decreases the further news sites are in the ideological distributions shown in Fig. 3C. The magnitude of the correlation does not change substantially over time and there is no apparent trend. (C) Regression results with the raw and filtered networks as dependent variable (data aggregated for 2018). The three models show consistent results: audience overlap is higher between news sites that are ideologically similar, according to the favorability scores. However, these two variables still leave much unexplained structure in the coexposure networks: the most predictive models explain just 16% of the data (much less when only the strongest overlap, or the backbone of the network, is considered).

