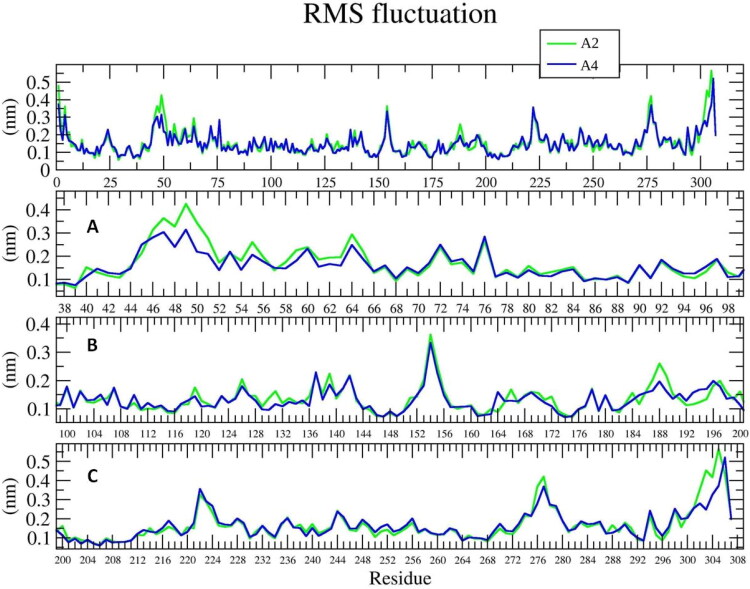
Figure 11.
The RMSF plot for each residue out of the four highly fluctuating regions, is show over the 50 ns MD simulation. A2 (green) and A4 (blue); (A): showing fluctuations in region 40 to 54; (B): Showing fluctuation in region 124 to 144 & 180 to 200; (C): showing fluctuation in region 272 to 306 during Mpro-Ligands complex.

