Fig. 6.
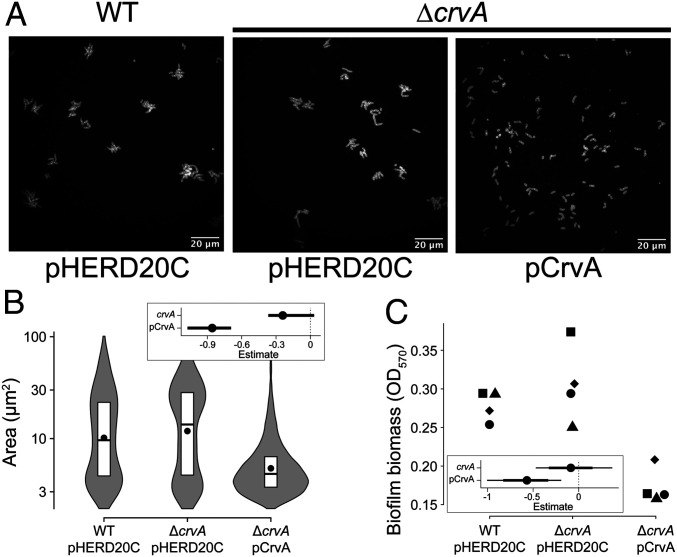
Curvature influences microcolony development and population level biofilm formation. (A) Representative images of V. cholerae microcolonies of WT harboring the control vector pHERD20C (Left), ∆crvA harboring the control vector pHERD20C (Center), and ∆crvA harboring the CrvA expression vector pCrvA (Right). Microcolonies were stained with FM4-64 prior to imaging. (Scale bars at Bottom Right of each image, 20 µm.) (B) Distributions of microcolony areas pooled from two independent experiments totaling between 700 and 2,000 microcolonies. The box represents the first, second, and third quartiles. The dot represents the mean. Each distribution represents between 500 and 1,000 cells analyzed and pooled from two separate experiments. (C) Biofilm biomass formed by different strains. Dot shapes represent independent replicates. (Insets) Estimated effects of genomic crvA or ectopic CrvA expression on the median microcolony area and biofilm biomass (dot = mean, thick line = 90% CI, thin line = 98% CI).

