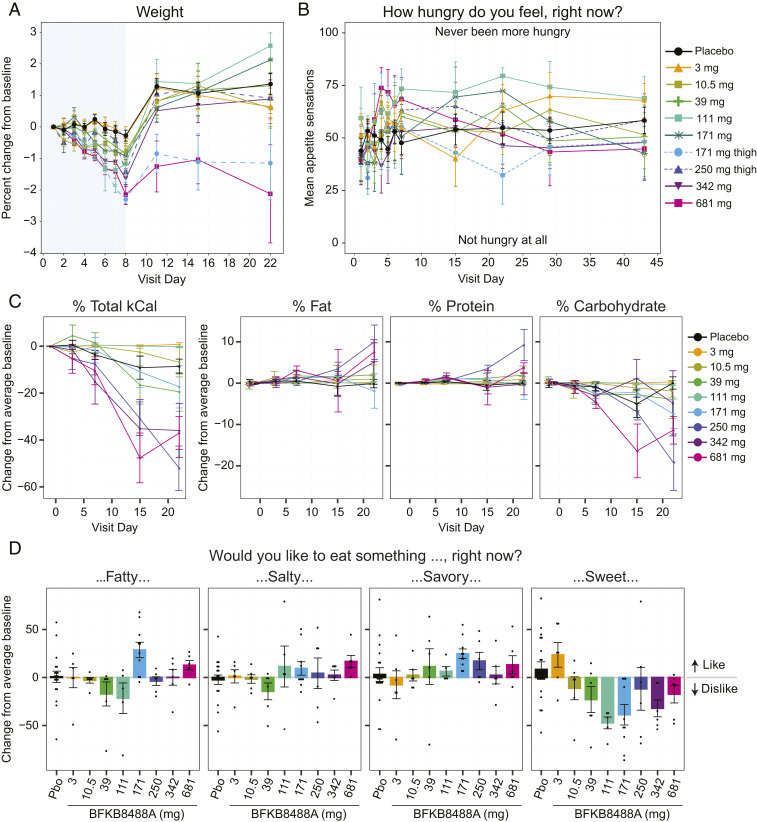
Fig. 4.
BFKB8488A treatment led to weight loss, reduced caloric intake, and altered food type preference in obese humans. (A) Percent change from predose baseline (mean ± SEM) in body weight. Blue shaded area indicates the confinement period (day −2 through day 8). (B) Appetite sensations (mean ± SEM) as measured by VAS from predose baseline day 1 through day 43. (C) Change from predose baseline (mean ± SEM) in total food consumption (measured in kCal), and fat, protein, and carbohydrate consumption through day 22. (D) Change from predose baseline (mean ± SEM) in cravings for fatty, salty, savory, and sweet food, measured by VAS on day 22. Positive scores indicate liking a food; negative scores indicate disliking a food. Baseline was defined for each participant as the average of day −1 and day 1 predose. For C and D, the 171-mg thigh and abdomen cohorts were combined. Pbo, placebo.

