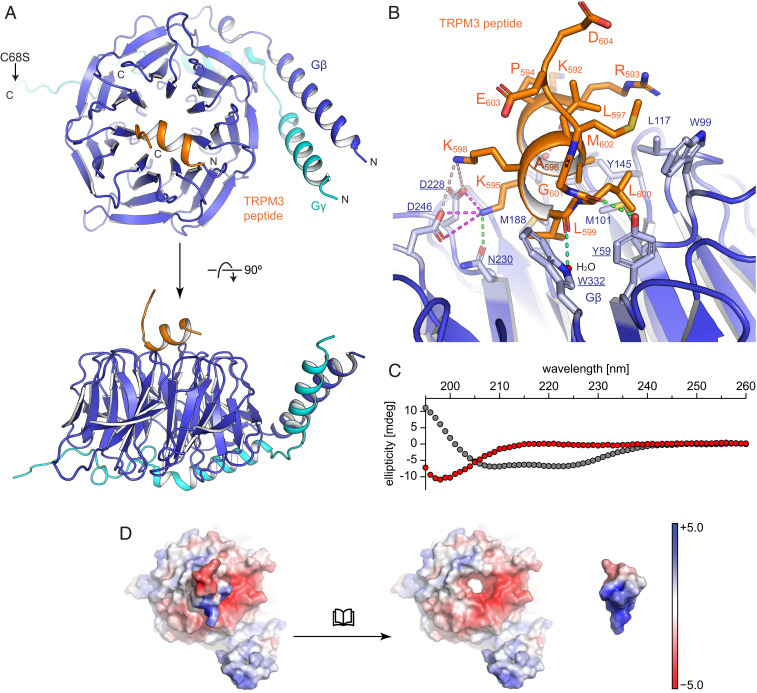
Fig. 3.
Structural analysis of the TRPM3 peptide bound to Gβγ. (A) Overview of the cocrystal structure of Gβγ and a peptide encompassing the TRPM3 exon 17–encoded amino acids in backbone representation with Gβ in blue, Gγ in cyan, and the TRPM3 peptide in orange. (B) A zoom-in to the interaction interface is shown in cartoon and stick representation. For Gβ (blue) only side chains involved in interactions are shown (labeled in blue and underlined for residues undergoing polar interactions and blue and not underlined for residues involved in hydrophobic interactions); for the peptide (orange) all side chains are shown. Polar interactions are indicated with dotted lines for electrostatic interactions (magenta for salt bridges and light magenta for long-range interactions) and hydrogen bonds (green). (C) Secondary structure analysis (using circular dichroism spectroscopy) of the peptide in solution (red dots, alone without interaction partners) shows the signal of a random coil structure. The calculated circular dichroism spectrum of the bound peptide (gray dots) has been included to demonstrate the signal expected from an α-helix. (D) Visualization of surface charges (calculated as “charge-smoothed potential” in PyMOL; red colors indicate negative charges, blue colors positive charges) of the TRPM3 peptide bound to Gβγ (Left) and of both parts displayed separately (Right) demonstrating the complimentary charges on the interacting surfaces. Note that the TRPM3-encoded peptide has been turned by 180° to reveal the charges on the surface that touches Gβ.

