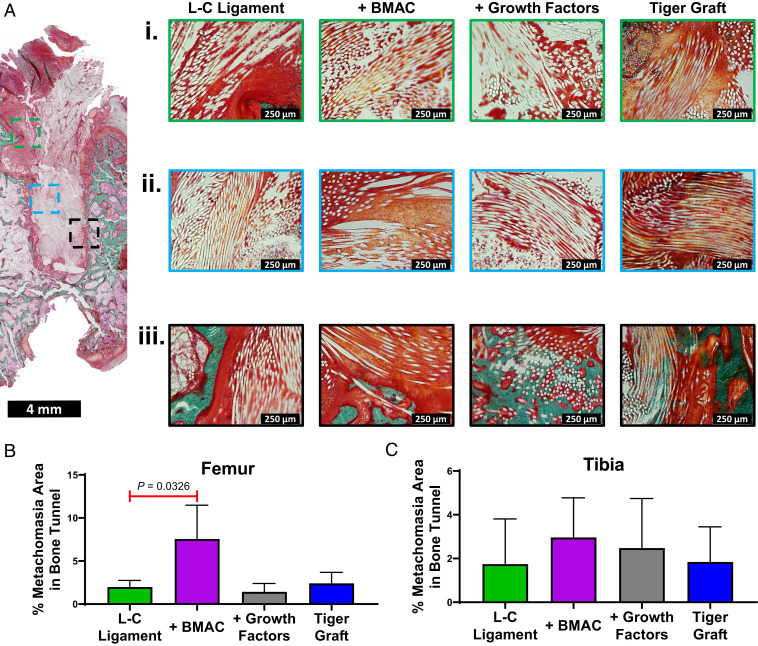
Fig. 5.
BMAC as well as growth factor treatment alter the cellular phenotype of regenerated tissue. (A) Representative Goldner’s Trichrome staining of the femur for the L-C ligament (n = 3, 12 wk post ACL reconstruction). The outlined boxes indicate area of higher magnification. The outlined boxes are color coded (green, enthesis area; light blue, bone tunnel proper; black, ligament–bone interface). Representative higher-magnification images of the (i) enthesis (ii) bone tunnel proper, and (iii) bioengineered ACL matrix–bone interface area for the L-C ligament, L-C ligament + BMAC treatment, L-C ligament + growth factors treatment, and tiger graft. The image of the entire bone tunnel length for the treatment groups can be found in SI Appendix, Fig. S2. (B and C) Area of metachromasia was quantified as a percentage of the bone tunnel area for toluidine blue stains in the femur and tibia. Mean area of metachromasia ± SD (n = 3, 12 wk post-ACL reconstruction); one-way ANOVA with Dunnett’s post hoc test.

