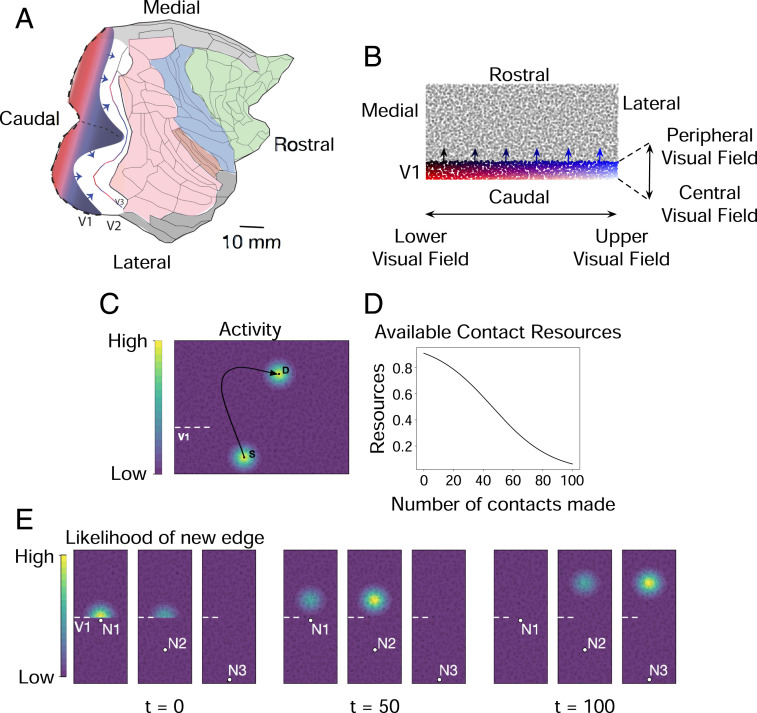
Fig. 1.
(A) Flattened representation of the right cortical hemisphere of a macaque monkey. The dotted line is where V1 is cut down the horizontal meridian to flatten it. Arrows show advancing axons exiting V1 into V2. The colored regions are frontal (green), limbic (gray), somatosensory (blue), and extended occipital–interparietal cortex (pink). Reprinted from ref. 48. Copyright (2015), with permission from Elsevier. (B) The initial state of the network model. Individual nodes represent a neural population under a 1 mm 1 mm piece of cortex. The network grows in sequential steps by forming new directed edges from nodes in V1 to nodes in the rest of the cortical sheet. (C) Contour plot illustrating spread of neural activity in a representative piece of the model. Activity of V1 node S generates correlated activity in its immediate spatial neighborhood. This activity falls off as a Gaussian outward from S. Activity in S also generates correlated activity on a distant node D to which S projects an edge to. Activity of D spreads to its neighborhood and falls off as a Gaussian outward from D. At each growth step, new edges preferentially form between nodes that have high activity correlations. (D) As new edges are added to a node, its available contact (synaptic) resources decreases as a sigmoidal function. New edges preferentially form between nodes that have a larger number of available contact resources. (E) Contour plot in a representative piece of the model, illustrating the likelihood (probability) of a new edge emanating from one of three nodes (S1, S2, S3) in V1 and terminating in any of the nodes outside of V1. The distribution of probabilities are shown at three different time points. In the network’s initial state (time t = 0, when no edges have yet formed), new edges are more likely to form between node S1 and nodes outside of V1 that are in immediate spatial proximity to S1. Subsequently at time t = 50 (followed by t = 100), new edges are more likely to form between node S2 (followed by S3) and nodes outside of V1 further along the caudorostral axis.

