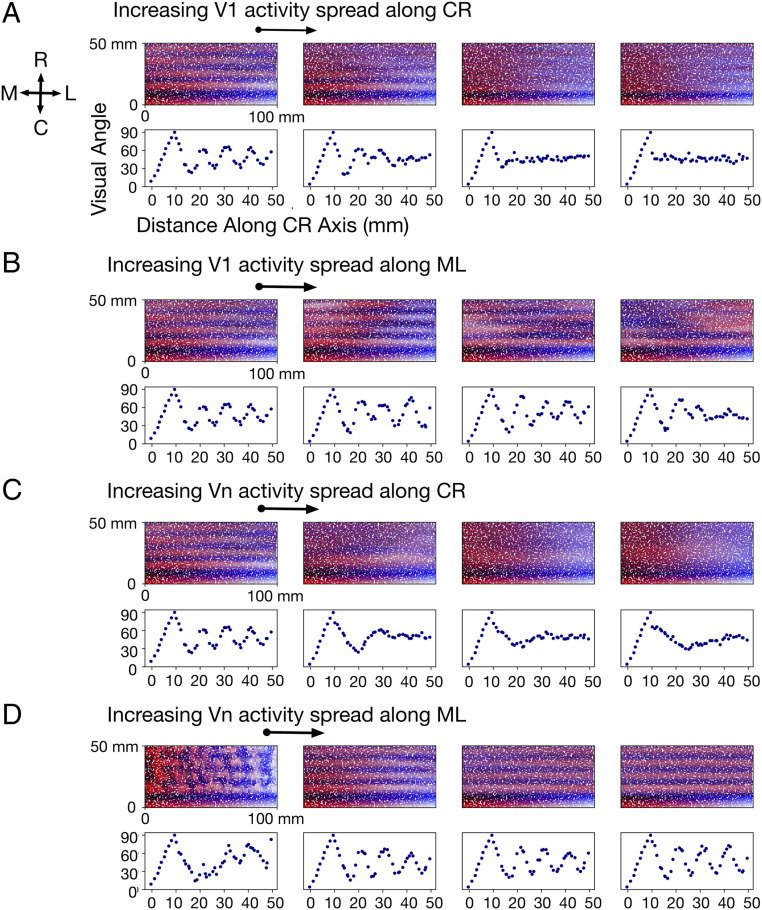
Fig. 3.
(A) Effect of increasing the activity spread in V1 along the caudorostral (CR) axis. From left to right, this spread ( in Eq. 1) is set to 0.5 mm (leftmost), 1.0 , 1.5, and 2.0 mm (rightmost), respectively. In all four sets of graphs, activity spread in V1 along the mediolateral (ML) axis is held constant at 0.5 mm, and activity spread in secondary visual areas along the CR and ML axes are held constant at 0.5 and 5.0 mm, respectively. Visual angles represented in a 1 mm × 50 mm slice along the CR axis are shown below each map. The visual angle represented in a node is measured as the mean of the visual angles represented in its incoming edges. (B) Effect of increasing the activity spread in V1 along the ML axis. In the four sets of graphs, from left to right, this spread ( in Eq. 1) is set to 0.5, 2.5, 5.0, and 7.5 mm, respectively. In all four sets of graphs, the spread in V1 along the CR axis is held constant at 0.5 mm, and that in secondary visual areas along the CR and ML axes are held constant at 0.5 and 5.0 mm, respectively. (C) Effect of increasing the activity spread in secondary visual areas (Vn) along the CR axis. In the four sets of graphs, from left to right, this spread is set to 0.5, 1.0, 2.5, and 5.0 mm, respectively. In all four sets of graphs, the spread in Vn along the ML axis is held constant at 5.0 mm, and that in V1 along the CR and ML axes are both held constant at 0.5 mm. (D) Effect of increasing the activity spread in Vn along the ML axis. In the four sets of graphs, from left to right, this spread is set to 0.5, 5.0, 12.5, and 25.0 mm, respectively. In all four sets of graphs, the spread in Vn along the CR axis is held constant at 0.5 mm, and that in V1 along the CR and ML axes are both held constant at 0.5 mm.

