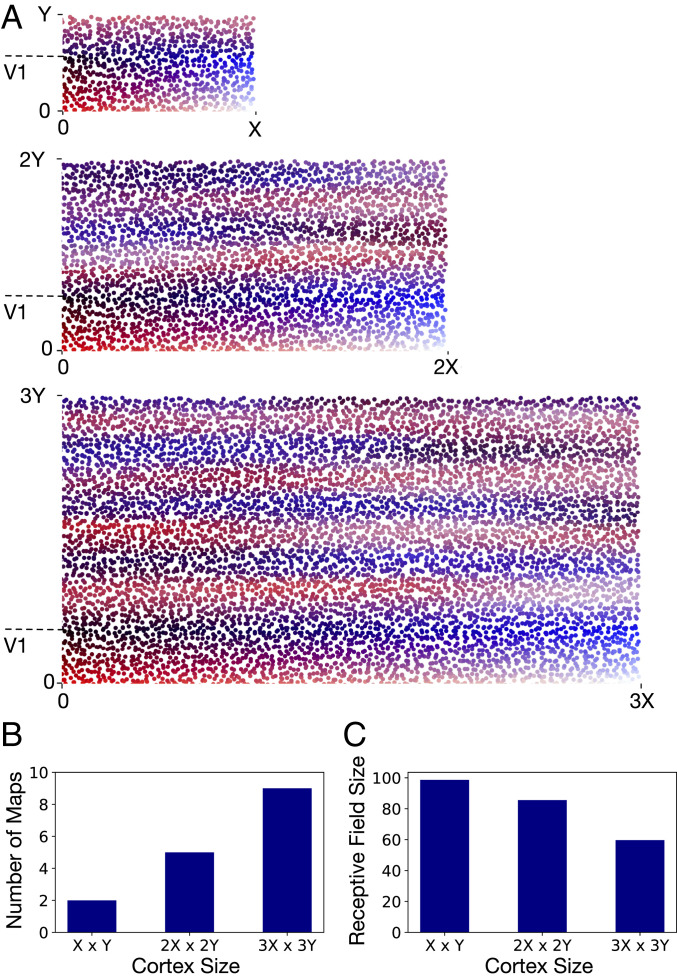
Fig. 4.
(A) As the size of the model cortex is increased, the developmental program generates systematic variations in cortical organization. Most notably, a larger number of topographically organized secondary visual areas emerge as the total surface area of the cortex is increased. The largest cortex shown is threefold larger along each dimension compared with the smallest cortex. The number of nodes per unit surface area is the same in all three cortices. The largest cortex has 7,200 nodes in total, and the two smaller cortices have 3,200 nodes and 800 nodes, respectively. The length of V1 along the propagating axis is held constant (at ) for all three cortices. (B and C) The number of maps and the average size of V2 receptive fields in the cortices shown in A. The receptive field size of a V2 node is measured as the SD of up-to-down visual-field angles represented in its incoming edges.

