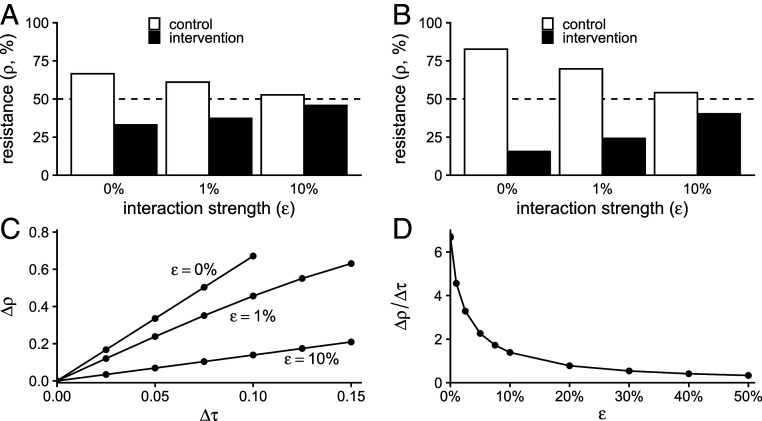
Fig. 1.
Simulated interactions between populations attenuate the effect of interventions. (A) Results of simulations of the two-population WHN model for a modest intervention (difference in antibiotic use between populations Δτ = 0.05 monthly treatments per capita; average of control and intervention treatment rates is 0.125). As interaction strength (ε, horizontal axis) increases, the difference in antibiotic resistance between the two populations decreases. The dashed line shows the resistance level in a population with a mean treatment rate of 0.125. (B) The same pattern holds for a stronger intervention (Δτ = 0.1, same average treatment rate). (C) The difference in resistance between populations (Δρ, vertical axis) increases with the difference in antibiotic use (Δτ, horizontal axis), but the rate of increase is lower with increasing interaction ε. (D) In the WHN model, the use–resistance relationship (Δρ/Δτ, vertical axis) declines exponentially with the interaction strength ε (Δτ fixed at 0.10).

